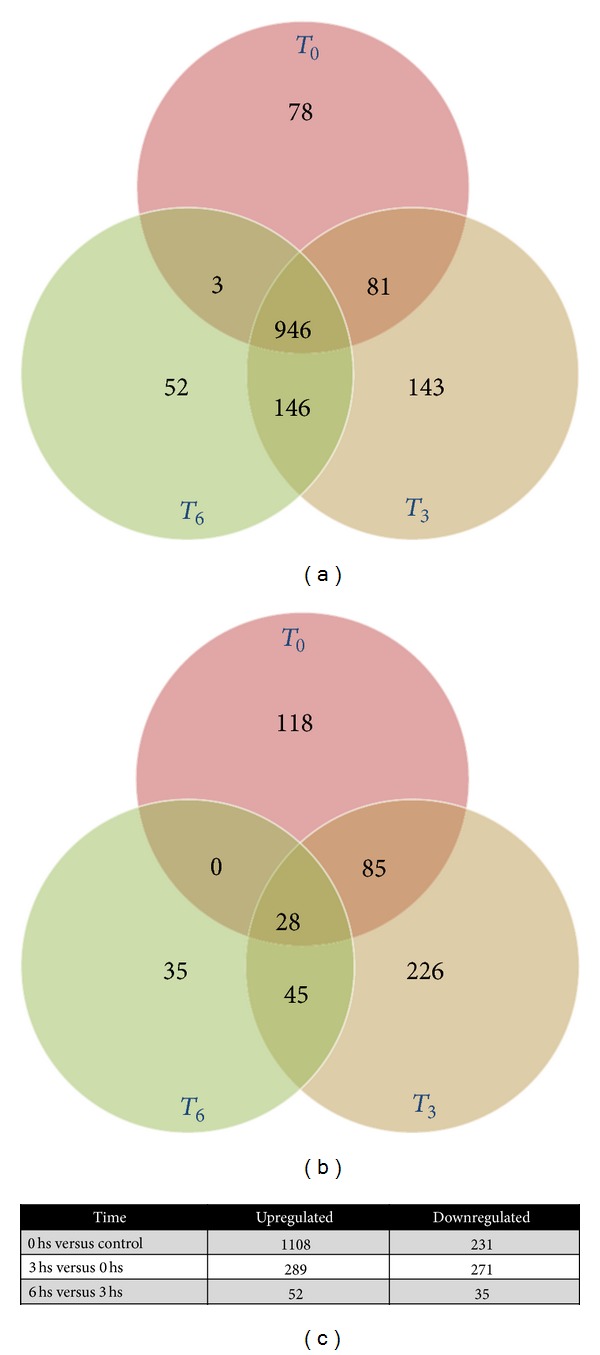
Figure 2.

Venn diagrams comparing (a) upregulated and (b) downregulated genes (fold change ≥ 2, P ≤ 0.05) with respect to control cells; (c) number of genes up- or downregulated, comparing one condition to the previous one (t 0 versus C, t 3 versus t 0, and t 6 versus t 3) using fold change ≥ 2 and P ≤ 0.05.
