
Figure 3.
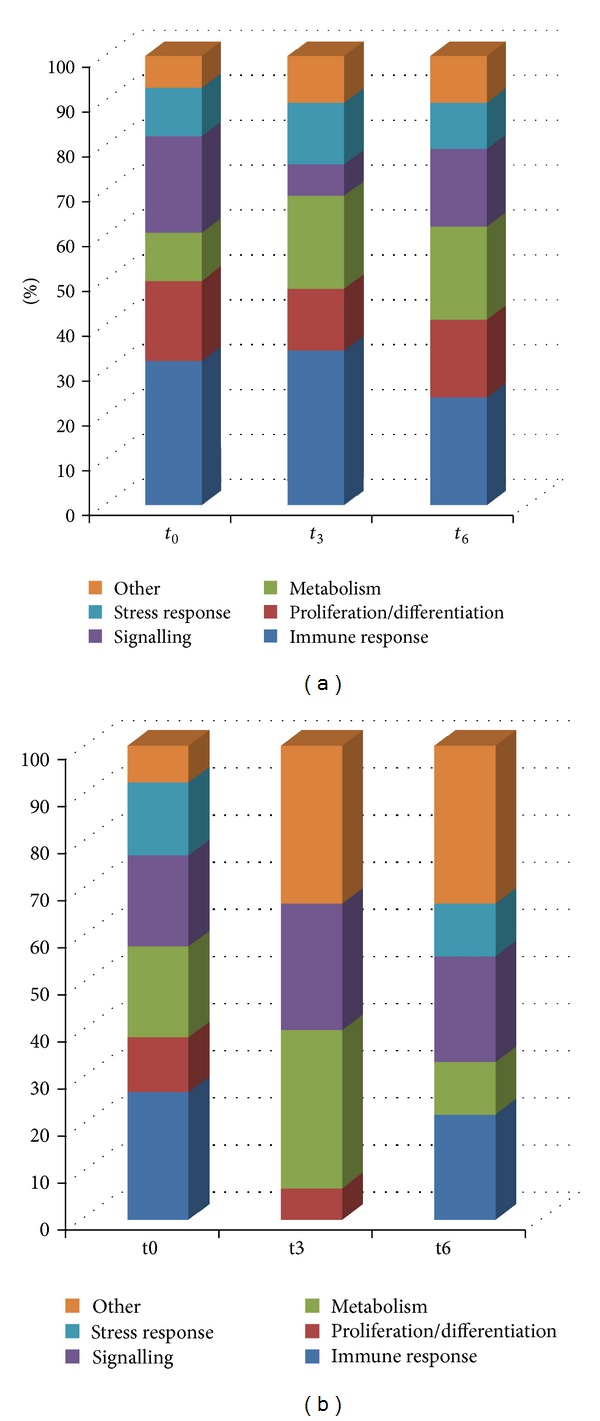
Cellular processes predicted to be modulated during T. cruzi infection. (a) Pathways analysis with upregulated genes from t 0, t 3, and t 6; (b) pathways analysis with upregulated genes comparing t 0 versus C, t 3 versus t 0, and t 6 versus t 3, showing characteristic pathways altered at each time point.