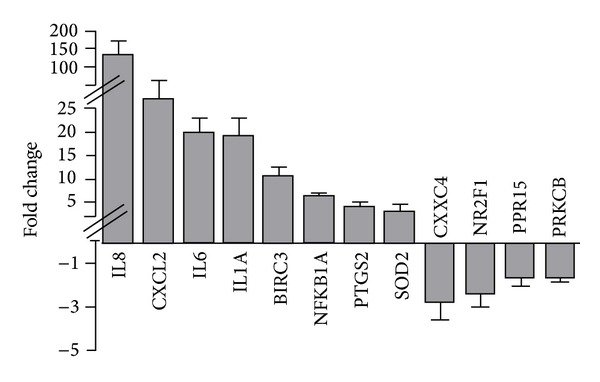
Figure 5.

Quantitation of selected genes by real-time PCR. Mean relative fold changes of upregulated and down-egulated genes analyzed by qPCR in 3 biological replicates of infected HeLa cells at t 0 relative to that in control cells. Error bar represents SD of replicates. The cross-bars in the y-axis indicate changes in the scale used.
