
Figure 3.
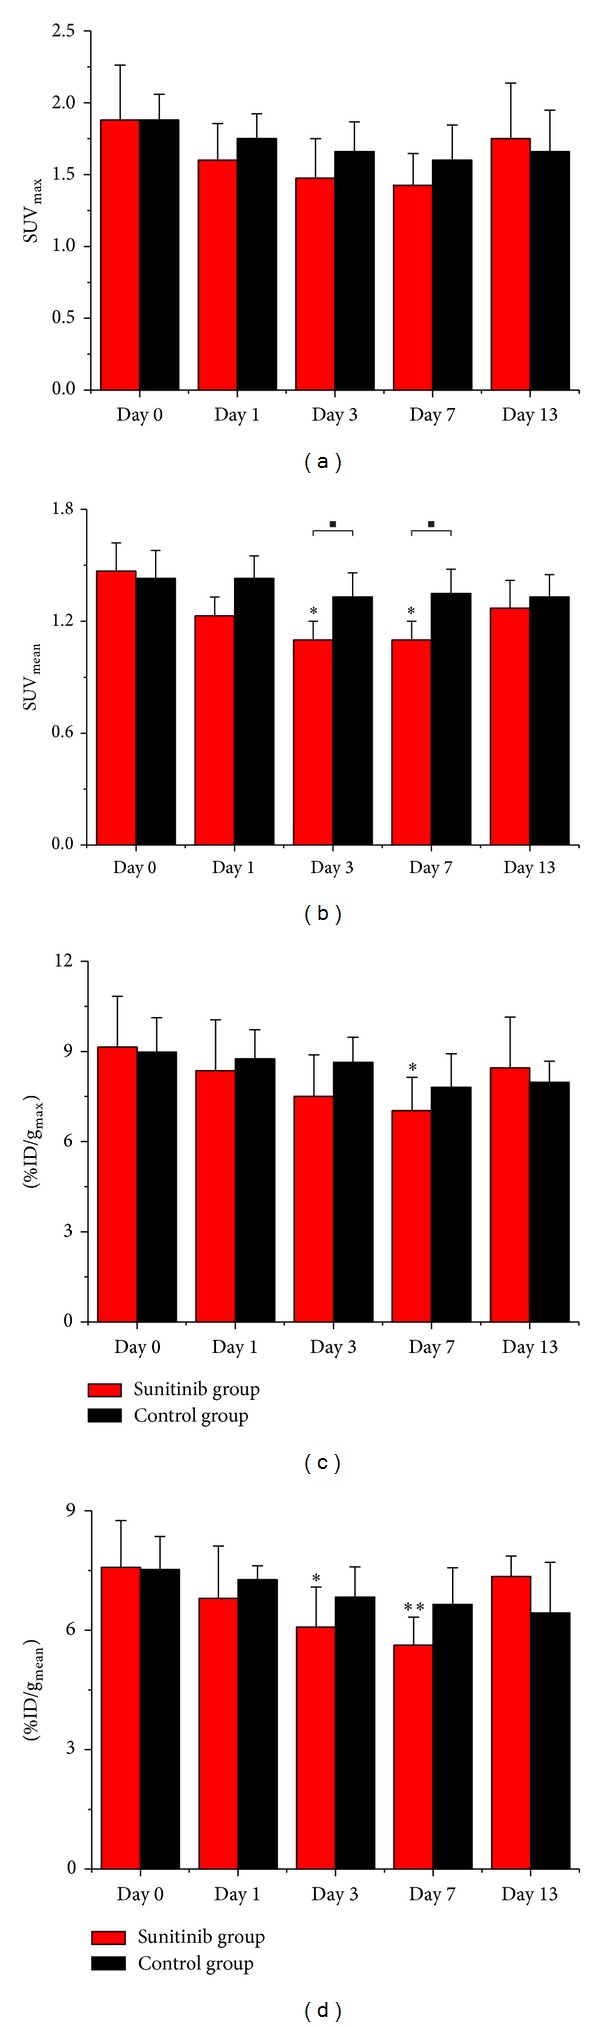
Quantitative ROIs analysis of tumor uptake from 18F-FLT microPET/CT. ((a) SUVmax, (b) SUVmean, (c) %ID/gmax, and (d) %ID/gmean) *P < 0.05 and **P < 0.01, within the Sunitinib group, compared to day 0. ■ P < 0.05, between the Sunitinib group and the control group.