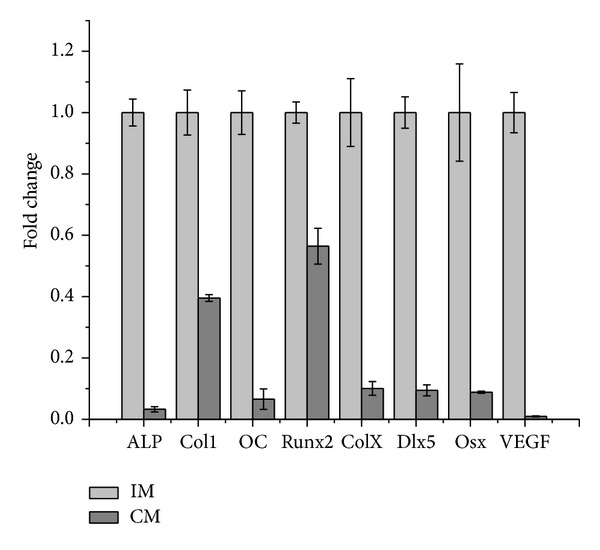
Figure 5.

Expression level of endochondral ossification related genes of ATDC5 cells induced in IM and CM at day 14. The results were presented as the means ± standard deviation (n = 3). Expression fold change of all genes had significant difference (P < 0.05) between IM and CM.
