
Figure 6.
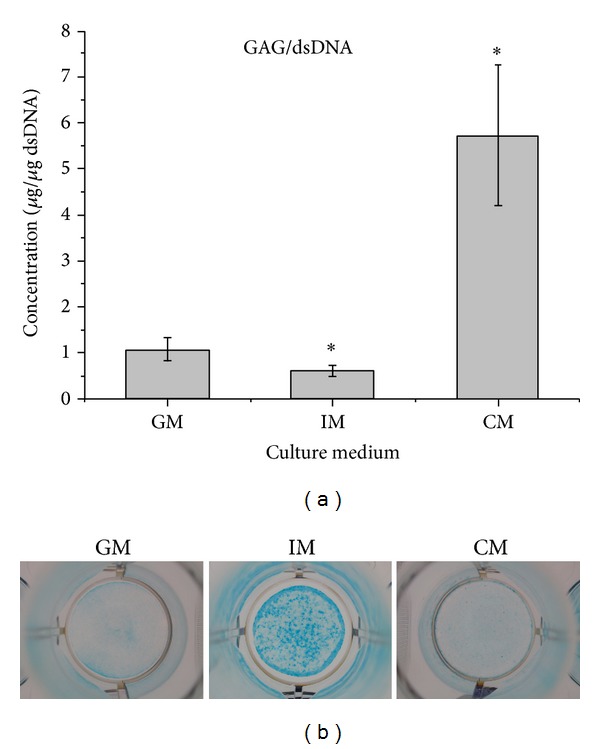
Analysis of GAG deposition of ATDC5 cells cultured in GM, IM, and CM for 21 d. (a) Quantitative analysis of GAGs synthesis using the 1,9-dimethylmethylene blue method. (b) Alcian Blue staining. The results were presented as the means ± standard deviation (n = 6). There was significant difference (P < 0.05) versus GM group.