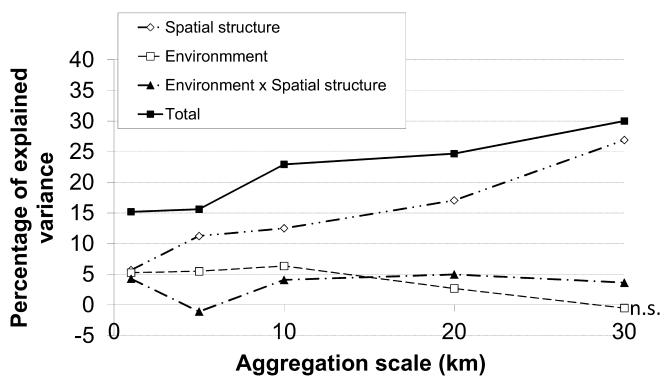
Figure 3. Variance partitioning of species composition at various spatial scales in grassland plant communities within the French Alps.
While the total variance explained (black squares) reflects the R2 for a redundancy analysis (RDA) including the spatial as well as the environmental components, the other curves represent the results from a variance partitioning: the R2 that can be attributed to the environment after controlling for spatial structure (white squares), the R2 that can be attributed to spatial structure (i.e. dispersal) after controlling for the environment (white diamonds), and the interaction between spatial structure and environment (black triangles), which can be attributed to either environmental influences that are spatially structured or to dispersal effects that are environmentally structured. n.s., non-significant (ANOVA permutation test, P-value > 0.05).

