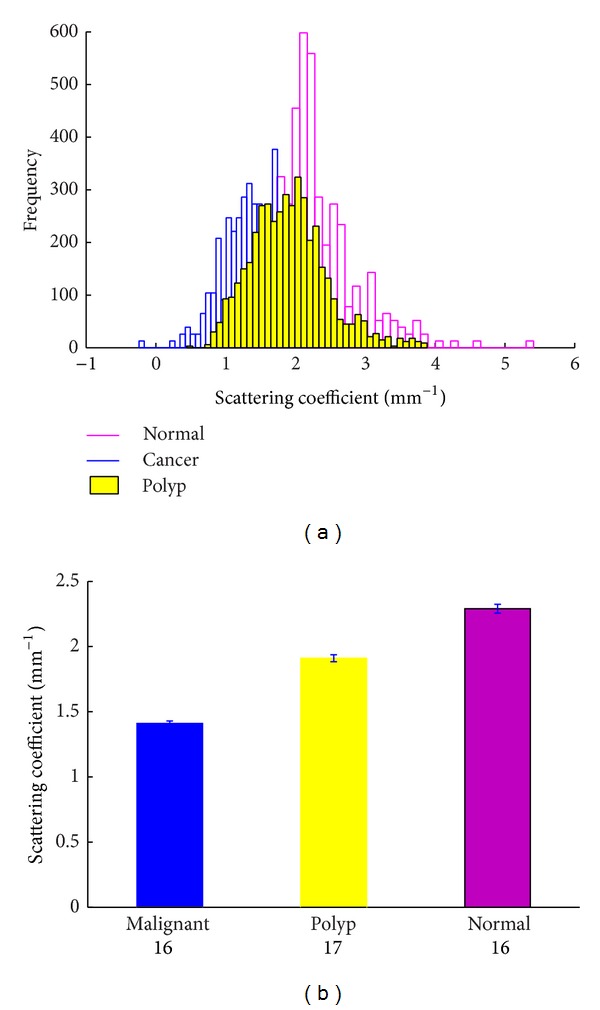
Figure 2.

(a) Normalized histograms of normal, polyp, and malignant tissue scattering coefficients; (b) comparison of μ s obtained from each tissue group. The error bars represent 95% confidence intervals of the extracted fit parameter. The numbers below each bar represent the number in the sample.
