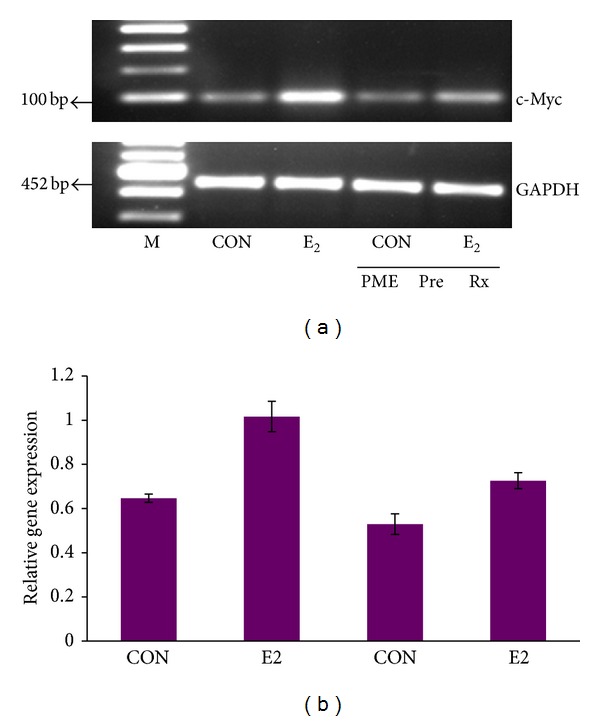
Figure 3.

Effect of PME pretreatment on E2 induced expression of c-Myc. (a) MCF7 cells were pretreated with 100 nM E2 for 4 hrs, with or without PME pretreatment (80 μg/mL) for 12 hrs and RT-PCR was done. (b) shows the ratio of density of c-Myc gene expression to that of endogenous control GAPDH and it represents mean ± SE of 3 replicates (*P < 0.05).
