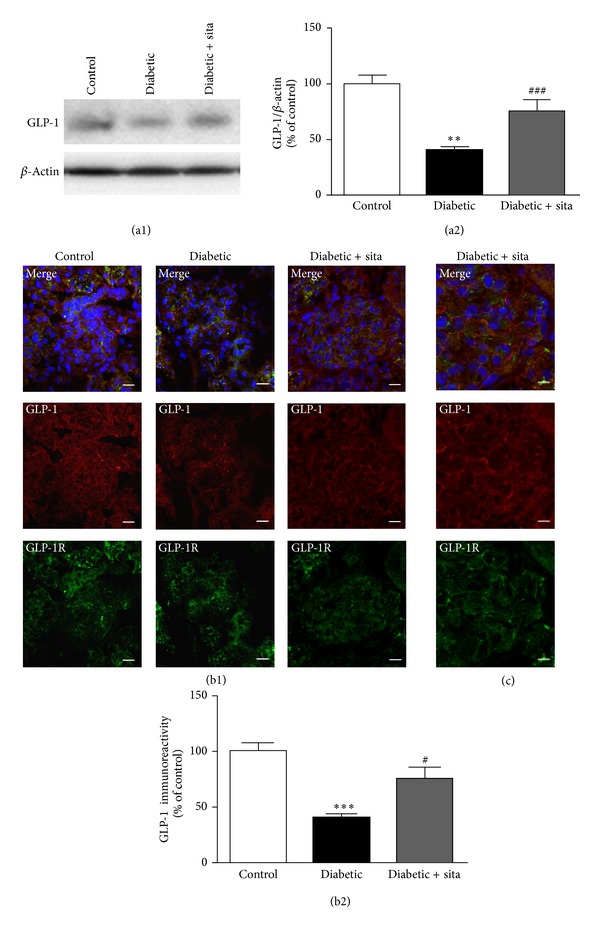
Figure 4.

Sitagliptin prevents the downregulation of GLP-1 and GLP-1R content in the kidney induced by diabetes. (a) The protein levels of GLP-1 were assessed in total kidney cell lysates by Western Blotting in ZDF (+/+) and ZDF (fa/fa) nontreated or treated with sitagliptin. The Western Blots presented are representative of each group of animals. (b) Representative confocal images for each group of animals showing GLP-1 (red) and GLP-1R (green) immunoreactivity and nuclear staining with DAPI (blue) in kidney sections (b1), as well as immunoreactivity quantification for GLP-1 (b2). Bars = 20 μm. Data are expressed as percentage of control and represent the mean ± SEM (n ≥ 6 per group); **P < 0.01 and ***P < 0.001 significantly different from control; # P < 0.05 and ### P < 0.001 significantly different from diabetic. (c) Magnification of representative confocal images for the group of ZDF (fa/fa) treated with sitagliptin showing colocalization areas of GLP-1 and GLP-1R (yellow) in kidney sections (6 μm). Bars = 10 μm.
