
Figure 2.
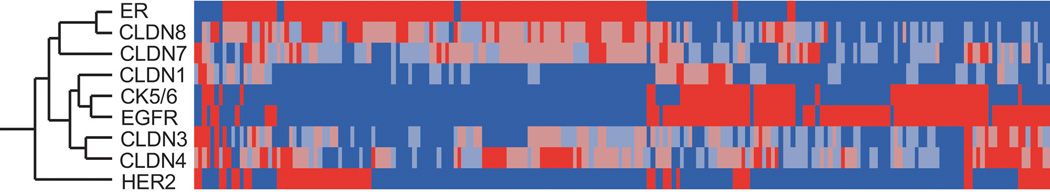
Hierarchical cluster analysis (Centroid method with data standardization) of claudin 1, 3, 4, 7, and 8 expressions and ER, HER2, CK5/6, and EGFR. Each column represents a different tumor, and each row represents a marker. Red: highest expression; blue: lowest expression. The analysis shows that Claudins 1, 3, and 4 clustered predominantly with cases positive for basal markers CK5/6 and EGFR, as indicated by short dendrogram branches linking these markers. Claudins 7 and 8 clustered with ER positive tumors.