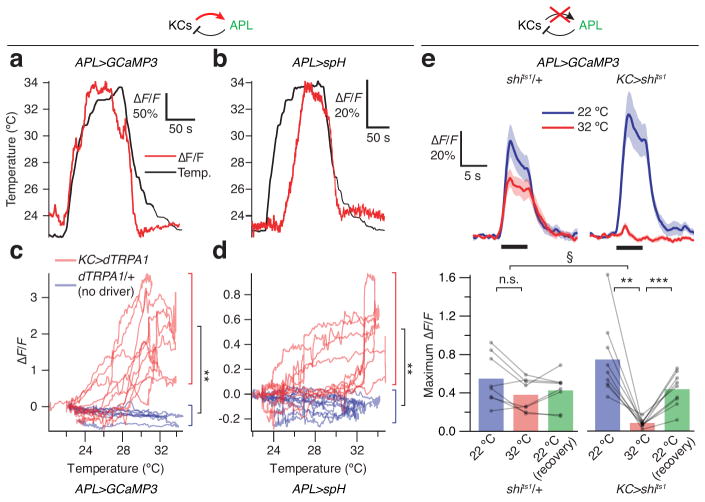
Figure 3. Kenyon cells activate APL.
(a,b) Thermal activation of Kenyon cells induces Ca2+ influx into APL in GH146>GCaMP3, mb247-LexA>dTRPA1 flies (a) and synaptic vesicle release from APL in GH146>spH, mb247-LexA>dTRPA1 flies (b). Red traces show ΔF/F; black trace show temperature. (c, d) ΔF/F of GCaMP3 (c) and spH (d) as functions of temperature; each trace represents one fly. Each red trace forms a loop: in mb247-LexA>dTRPA1 flies, ΔF/F rises as the fly is heated, and falls along a different trajectory as the fly is cooled (n=5). Heat does not induce Ca2+ influx in GH146>GCaMP3, dTRPA1/+ flies or vesicle fusion in GH146>spH, dTRPA1/+ flies (blue traces; GCaMP3: n=4; spH: n=5). ** P<0.01, unpaired Welch t-test, comparing the maximum ΔF/F (between 30 °C and the temperature maximum) between mb247-LexA>dTRPA1 and control flies. Mean ± s.e.m.: GCaMP3, mb247-LexA>dTRPA1, 1.90 ± 0.44; GCaMP3, dTRPA1/+, −0.27 ± 0.05; spH, mb247-LexA>dTRPA1, 0.68 ± 0.09; spH, dTRPA1/+, 0.06 ± 0.007. (e) Temperature block of transmission from Kenyon cells blocks odor-evoked APL responses in GH146>GCaMP3, mb247-LexA>shits1 flies (right) but not in GH146>GCaMP3, shits1/+ flies (left). *** P<0.001, repeated-measures ANOVA with Geisser-Greenhouse correction and Holm-Sidak multiple comparisons test. n=8, 9. § P<0.01, Mann-Whitney U test, comparing ratios of odor-evoked Ca2+ influx at 32 °C vs. 22 °C between control and mb247-LexA>shits1 flies. Black bars indicate 5 s pulses of ethyl acetate. Schematics on top indicate which neuron is imaged (green) and which connection is being manipulated (red arrow for dTRPA1 activation, red X for shits1 blockade). See Supplementary Table 1 for full genotypes.

