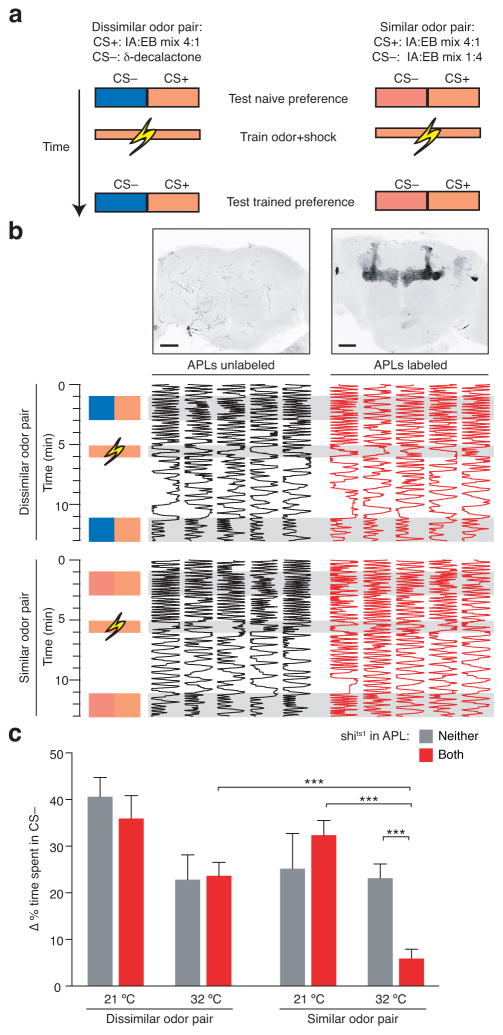
Figure 7. Feedback inhibition facilitates learned discrimination of similar, but not dissimilar, odors.
(a) Schematic of training paradigm. See text for details. (b) Individual odor preferences before and after training. Fly position within the chamber (horizontal dimension) is plotted against time (vertical dimension). Maximum intensity projections of confocal image stacks show example APL>shits1,GFP brains with none or both APL neurons labeled. Scale bars, 50 μm. (c) Performance of APL>shits1,GFP flies sorted according to whether neither or both APL neurons were labeled. Scores are plotted as change in the proportion of time spent in CS− after training. n, left to right, given as number of flies [number of experiments]: 23 [6], 26 [6], 16 [7], 44 [7], 18 [8], 55 [8], 32 [9], 51 [9]. ** P<0.01, *** P<0.001, Kruskal-Wallis ANOVA with Holm-Bonferroni correction for post hoc tests, testing only pairs of data points with one variable changed (task, temperature, or APL labeling). P<0.01, 3-way ANOVA for interaction of task, temperature, and APL labeling. P<0.005, 2-way ANOVA for interaction of genotype and temperature for discrimination of similar odors. P<0.01, 2-way ANOVA for interaction of task and APL labeling at 32 °C. P<0.05, 2-way ANOVA for interaction of task and temperature for flies with both APL neurons labeled. Other 2-way ANOVAs did not reveal significant interactions. Error bars show s.e.m.

