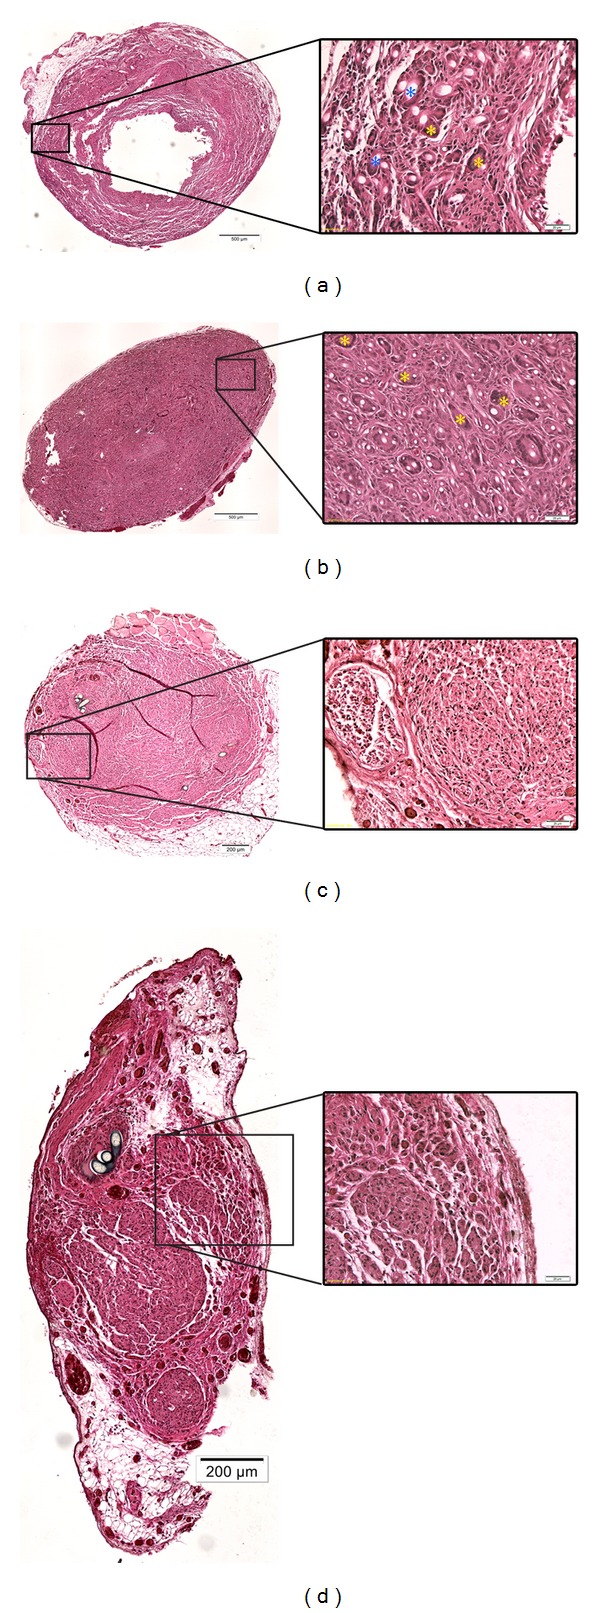
Figure 4.

Evaluation of immunological events by HE staining. Representative photomicrographs of graft cross-sections consecutive to the sections shown in Figure 3 stained with hematoxylin and eosin. (a) COM graft, 2 weeks after implantation (dislocated inner chitosan core is not shown), (b) COM graft, 13 weeks after implantation, (c) ANT graft, 13 weeks after implantation, (d) CES graft, 13 weeks after implantation. Overview images were taken at 10x magnification (left column, scale bar (a)-(b): 500 μm, (c)-(d) 200 μm). Details taken at 20x magnification allow identification of FBGCs (right column, scale bars 20 μm). Yellow asterisks mark FBGCs without ingested material ((a) + (b) right column), whereas blue asterisks mark FBGCs with ingested material ((a), right column).
