
Figure 8.
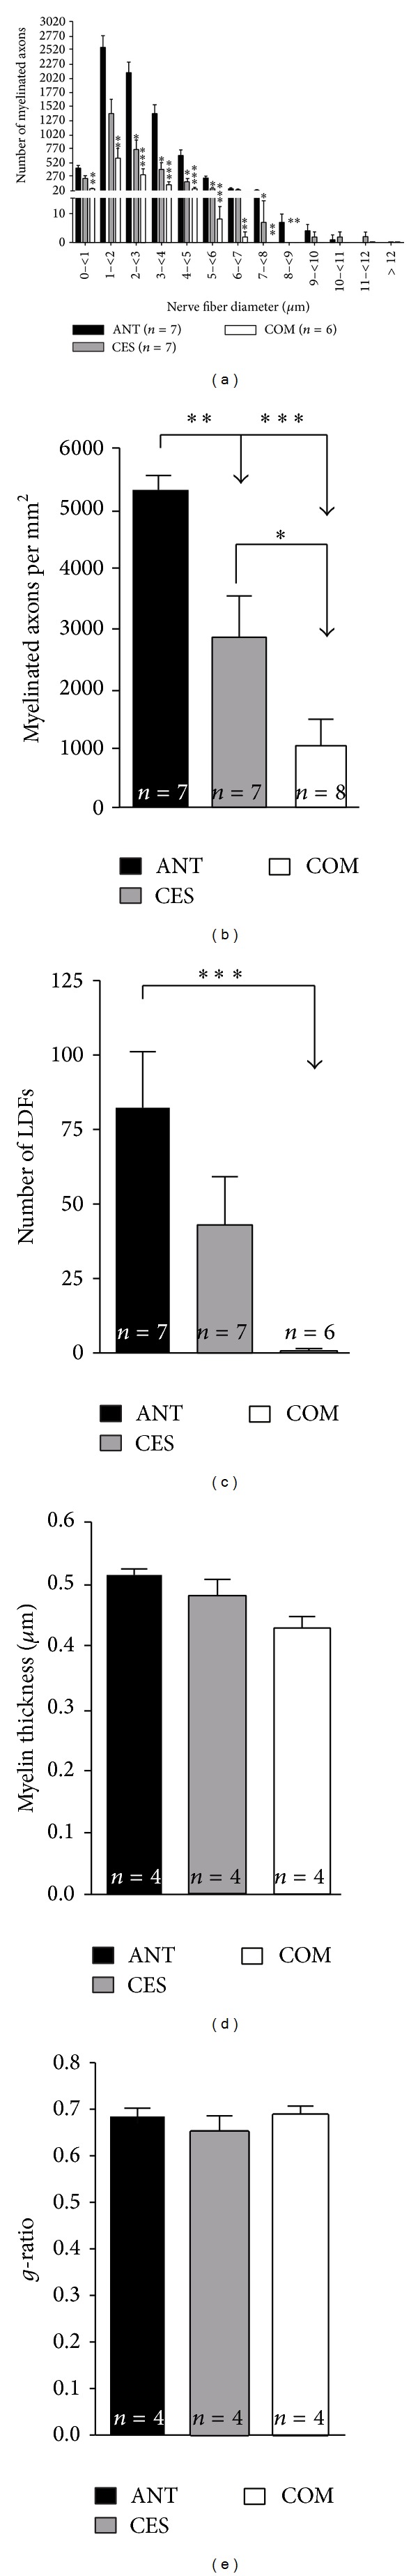
Histomorphometric analysis. The analysis of nerve fibers at +10.5 mm distal to proximal nerve end at 13 weeks after surgery is shown. (a) Myelinated nerve fiber distribution according to number of fibers per class of fiber diameters. Bars represent mean ± SEM. Significant differences to the ANT group are marked as *P < 0.05, **P < 0.01, and ***P < 0.001. (b)–(e) Results of nerve morphometry with nerve fiber density (b), number of large diameter fibers (c), myelin thickness (d), and g-ratio (e). Bars represent mean ± SEM of the given data. Intergroup differences are indicated by *P < 0.05, **P < 0.01, and ***P < 0.001.