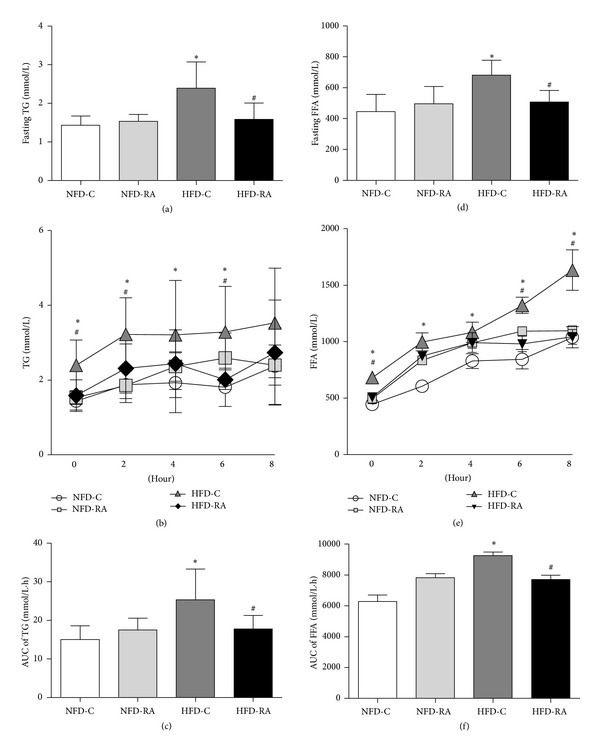
Figure 2.

RA treatment decreases TG and FFA levels after a 5-hour fast and olive oil gavage. (a) TG concentrations in rats in the NFD-C, NFD-RA, HFD-C, and HFD-RA groups after a 5-hour fast (n = 5–8/group). (b) TG concentrations in rats in the NFD-C, NFD-RA, HFD-C, and HFD-RA groups after olive oil gavage (n = 5–8/group). (c) The AUC of TG levels during olive oil challenge is shown. (d) FFA concentrations in rats in the NFD-C, NFD-RA, HFD-C, and HFD-RA groups after a 5-hour fast (n = 5–8/group). (e) FFA concentrations in rats in the NFD-C, NFD-RA, HFD-C, and HFD-RA groups after olive oil gavage (n = 5–8/group). (f) AUC of FFA levels during olive oil challenge is shown. *P < 0.05 (HFD-C group versus NFD-C group) and # P < 0.05 (HFD-RA group versus HFD-C group).
