
Figure 4.
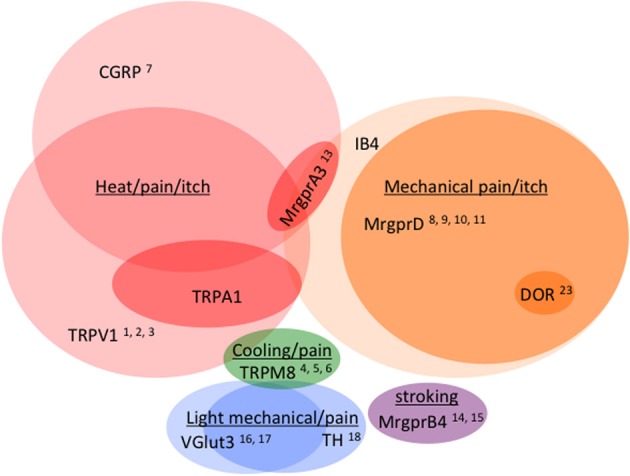
Venn diagram illustrating the distribution of markers across different classes of C fibers (not to scale). Numbers reference the mouse lines listed in Table 2.
Official websites use .gov
A
.gov website belongs to an official
government organization in the United States.
Secure .gov websites use HTTPS
A lock (
) or https:// means you've safely
connected to the .gov website. Share sensitive
information only on official, secure websites.
Venn diagram illustrating the distribution of markers across different classes of C fibers (not to scale). Numbers reference the mouse lines listed in Table 2.