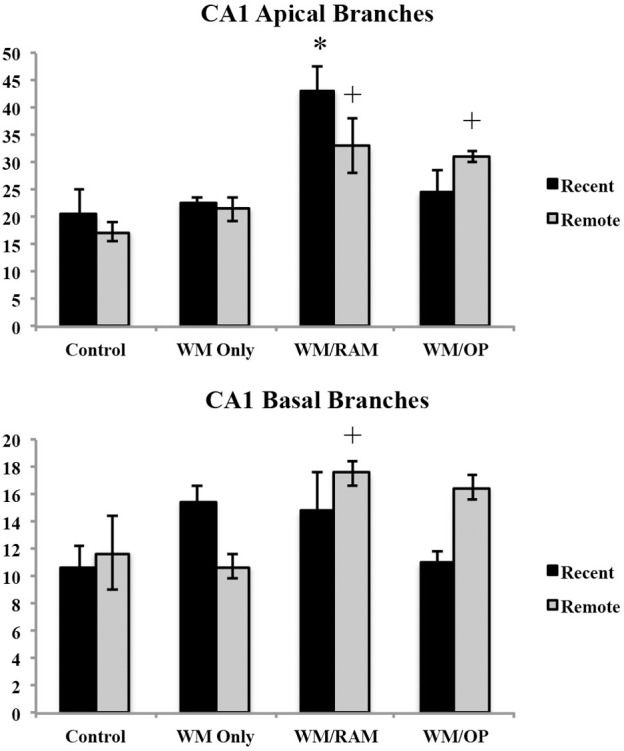
Figure 9.

Total number of branches in the CA1 in apical and basal dendrites. Only significant differences between behavioral groups and their respective control group are displayed. Refer to Results section for all comparison results. *Significantly different from Control:recent group (p < 0.05); +Significantly different from Control:Remote (p < 0.05).
