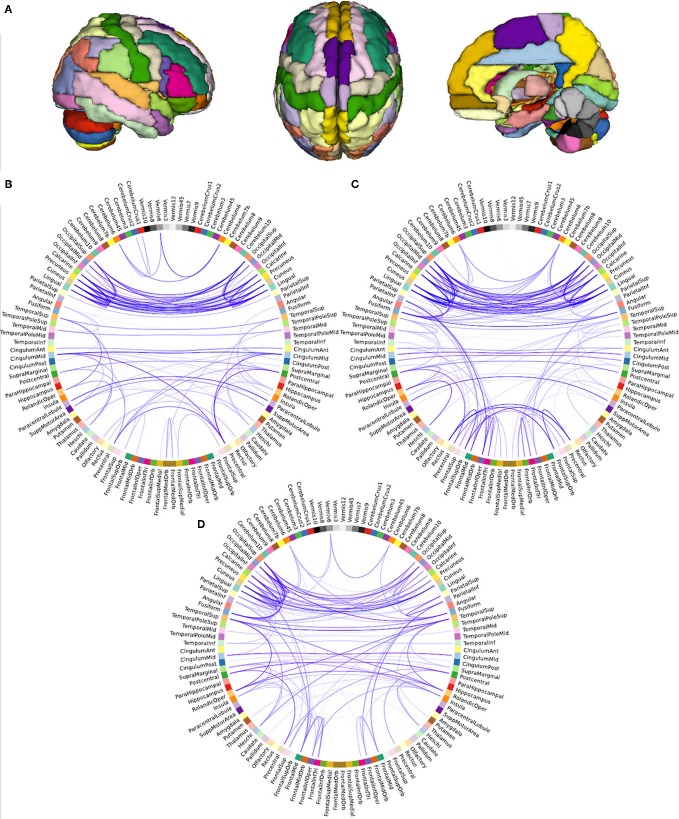
Figure 2.
Visualization of network creation. Parcellation of brain into 116 regions (A), and structure of weighted resting state functional networks of a representative control (B), yoga practitioner (C), and meditator (D). Networks depicted were thresholded (r = 0.5) for illustrative purposes only. Opacity of the lines represents strength of the correlation (more saturated is stronger), relative to the strength of the strongest correlation.

