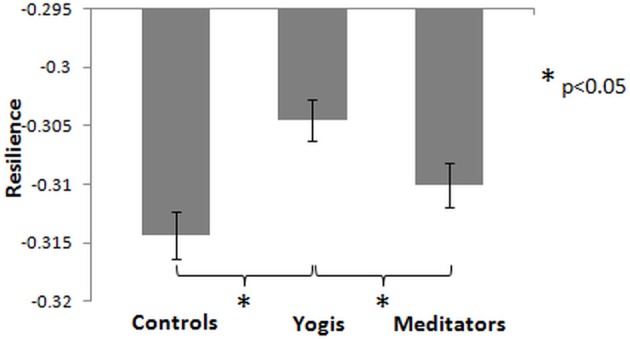
Figure 4.

Mean of functional network resilience, measured as the change in global efficiency after removal of the 15 nodes with the highest degree centrality. Less decrease means higher resilience. Error bars represent the standard error of the mean. P-values are based on two-tailed independent samples t-tests.
