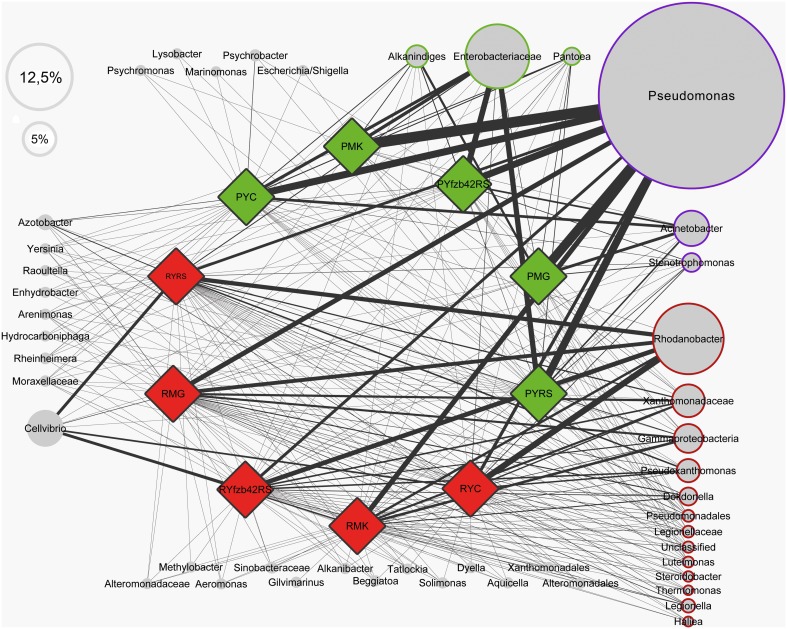
Figure 2.
Profile clustering network visualizing the investigated groups of lettuce (var. Tizian) and conjoined taxa. Red diamonds indicate samples derived from the roots and green diamonds from the lettuce foliage, respectively. Nodes represent taxa derived from the RDP classifier and the node sizes correspond to the mean relative abundance of all samples. The abundance of a certain taxa correlated to a particular investigated group is visualized trough the line width of the corresponding connection. The frame color represents the affiliation to the observed core taxa (green—phyllosphere, red—rhizosphere, blue—occurrence in both habitats and all samples, white—not a core taxon). Taxa less abundant than mean ≤0.5% are displayed without size-correlation. Abbreviations: P, phyllosphere; R, rhizosphere; Y, young; M, mature; RS, R. solani; C, untreated (control); FZB42RS, FZB42 and R. solani co-inoculation; G, healthy; K, diseased.

