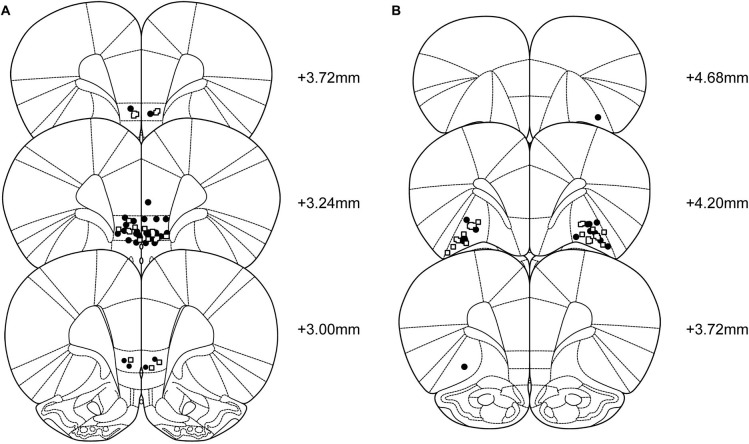
Figure 1.
Representation of the location of the infusions into the (A) infralimbic cortex (CORT: black circles, n = 21; vehicle: open squares, n = 13), and (B) lateral orbitofrontal cortex groups (CORT: black circles, n = 11; vehicle: open squares, n=12). Sections correspond to the atlas of Paxinos and Watson (2005).

