Figure 3.
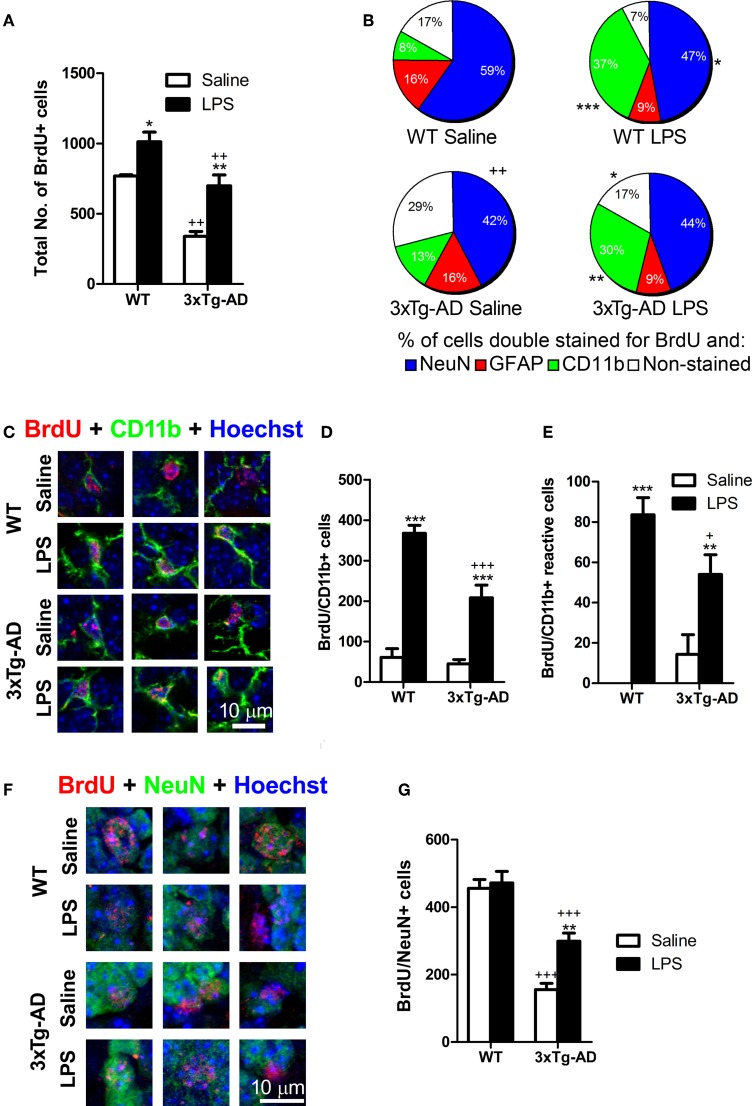
Net outcome of early LPS effects on different types of proliferating cells. (A) Total number of BrdU cells was significantly reduced in 3xTg-AD mice but increased in the dentate gyrus of mice treated with LPS. (B) The proportion of newly-generated neurons (NeuN/BrdU cells) was diminished in 3xTg-AD mice (compared with WT mice) while the percentage of microglial/macrophage cells (CD11b/BrdU+ cells) was increased after LPS treatment. (C) Confocal microscopy images showing double stained BrdU/CD11b-positive cells in the granule cell layer/subgranular zone of the dentate gyrus (hypertrophic cells showing thick processes emerging from their cell body were considered as reactive). (D) Total number of BrdU-stained microglial/macrophage cells was increased after LPS treatment in both WT and 3xTg-AD mice. However, this increase was smaller in 3xTg-AD mice. (E) Total number of reactive BrdU/CD11b-positive cells was increased after LPS treatment. (F) Confocal microscopy images showing double stained BrdU/NeuN- positive neurons in the granule cell layer/subgranular zone of the dentate gyrus. (G) Total number of BrdU/NeuN-positive neurons was reduced in 3xTg-AD mice but increased by LPS administration. Data represent mean ± s.e.m. *p < 0.05, **p < 0.01, ***p < 0.001 (LPS vs. saline-treated mice). +p < 0.05, ++p < 0.01, +++p < 0.001 (3xTg-AD vs. WT mice). Number of mice: WT Saline n = 4, WT LPS n = 5, 3xTg-AD Saline n = 5 and 3xTg-AD LPS n = 5.

