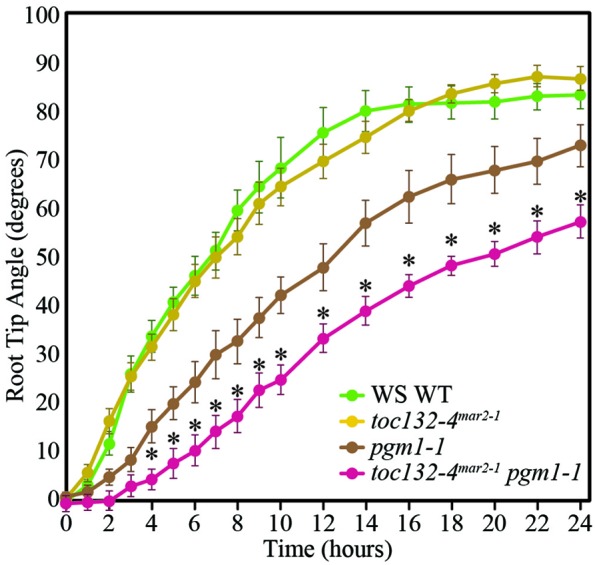
Figure 4.

toc132-4mar2−1pgm1-1 plants showed slower root reorientation kinetics than toc132-4mar2−1 and pgm1-1 single mutants. The error bars represent the standard error, and n = 10. The asterisks represent significant differences between pgm1-1 toc132-4mar2−1 and the corresponding single mutants (p < 0.05, Student's T-Test). Similar results were obtained in two additional independent experiments.
