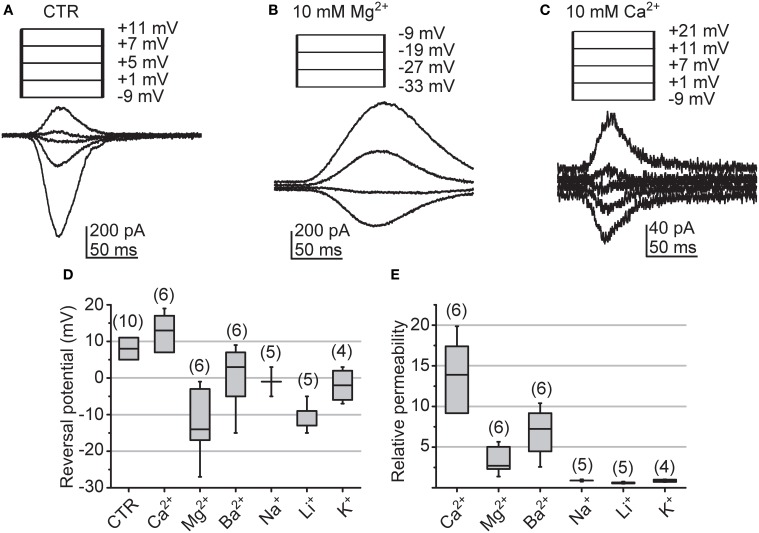
Figure 10.
Reversals of light-induced currents and the relative ionic permeabilities of the associated channels. (A–C) Erev of LICs in a single representative cell determined under bi-ionic conditions with 120 mM intracellular Cs+ and either normal cockroach bath solution (CTR), 10 mM Mg2+, or 10 mM Ca2+ in bath (as indicated). Responses were elicited with 50 ms sub-saturating light flashes and stepping the holding potential within a desired voltage interval (from −24 to 16 mV in Ringer; from −20 to 20 mV in Ca2+; from −40 to 0 mV in Mg2+; all with 2 mV increments). For clarity representative traces around the Erev and the corresponding voltages are shown. Values are corrected for the LJP. (D) Statistics of measured Erev with CTR and under bi-ionic conditions. The box-plot shows the median (horizontal line in the box), the 1st and 3rd quartiles (the ends of the boxes) and the minimum and maximum values (whiskers). (E) Statistics of the relative permeabilities for Ca2+, Mg2+, Ba2+, Na+, Li+ and K+; box-plot as in (D). The numbers presented above each box represent the number of analyzed cells. The permeabilities were calculated according to Equations (7) and (8). Concentration of all other ions as explained in the Methods.

