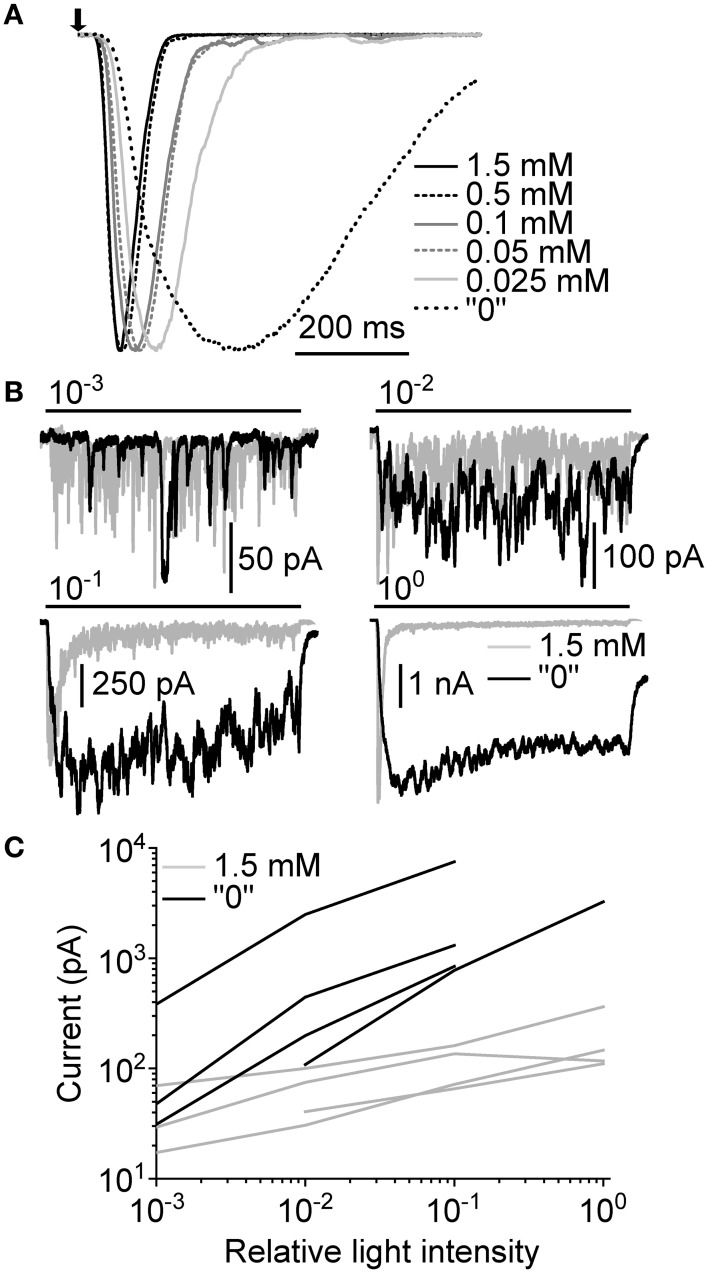
Figure 8.
Ca2+-dependence of macroscopic light-induced currents. (A) Normalized responses to a 10 ms flash (arrow) at different Ca2+ concentrations. The flash was estimated to contain ~200 effective photons over the whole concentration range. (B) Responses to a 10 s light pulse (bars) at 1.5 mM and “0” extracellular Ca2+. Relative light intensities are indicated above the light stimulus bars. (C) Comparison of average plateau currents (10 s light pulse) of four cells at 1.5 mM and “0” [Ca2+] plotted as function of relative light intensity.

