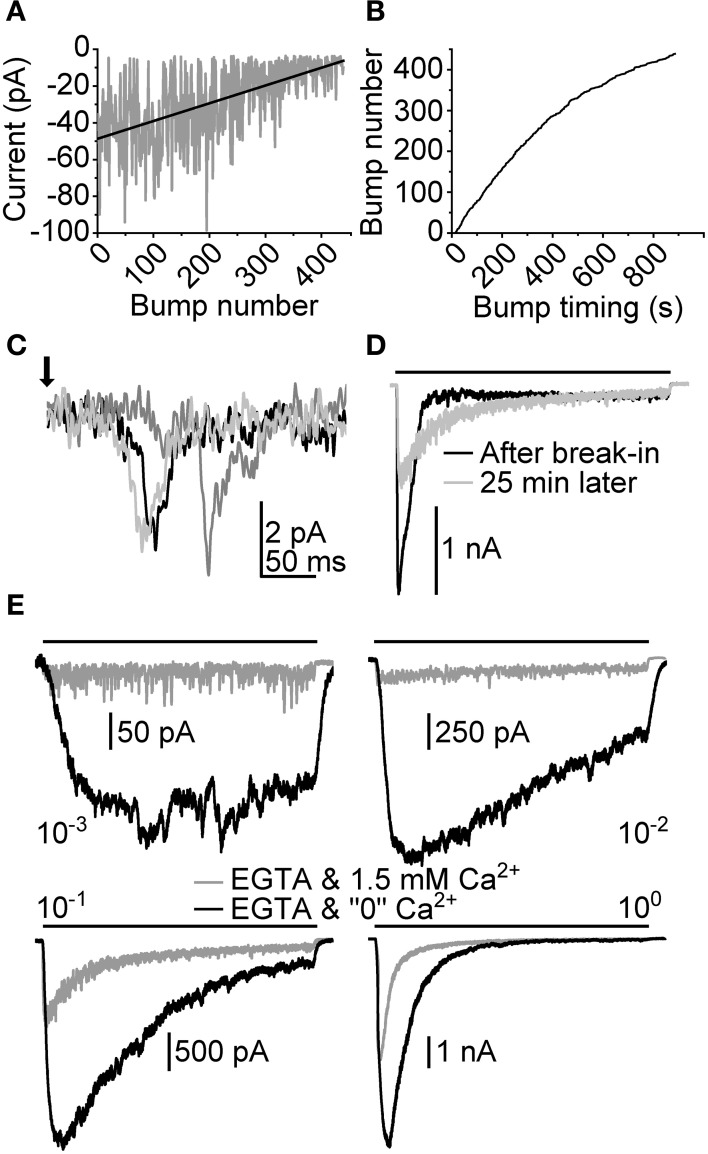
Figure 9.
Effects of intracellular Ca2+ chelation on light-induced currents. Intracellular Ca2+ was chelated using 10 mM EGTA (~6 mM free EGTA) in pipette solution. (A) Peak amplitudes of bumps (A) collected from a recording made with 870 s (14.5 min) continuous dim light after achieving whole-cell configuration. The linear fit depicts the slow deterioration of bump A in time. (B) Bump occurrence times obtained from the same recording as in (A). The declining tail of the plotted trace indicates a gradual decrease of bump appearance frequency (i.e., light sensitivity). (C) Illustration of effects of EGTA on flash-induced bumps. The bumps were recorded ~30 min after establishing whole-cell configuration. (D) Effects of 10 mM EGTA on a macroscopic response to a 10 s light pulse (bar; relative intensity 10−1). (E) Responses to a 10 s light pulse at 1.5 mM and “0” [Ca2+] while the pipette solution is loaded with 10 mM EGTA.

