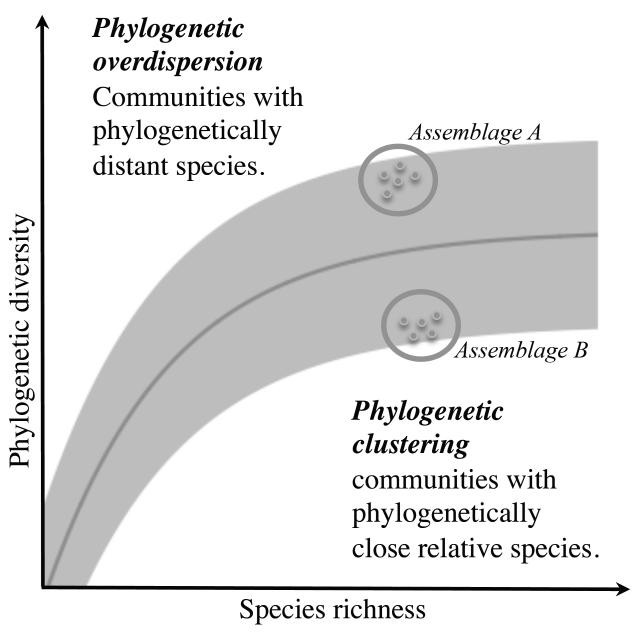
Figure 1. Hypothetical relationship between phylogenetic diversity and species richness (SR) of species assemblages.
The grey region corresponds to the possible interval of phylogenetic diversity values for a given number of species while the darker line indicates the theoretical expected values of phylogenetic diversity. For an assemblage of few species, we would expect that the addition of one species will lead to a sharp increase in phylogenetic diversity value, this new species being likely to add new phylogenetic information, whereas at high level of SR all the combinations of phylogenetic diversity have already been sampled and the addition of a new species does not influence the value of phylogenetic diversity for the region. As an example, region A shows an assemblage where phylogenetic diversity is higher than expected by its common relationship with SR. This type of assemblage would probably include phylogenetically distant species, reflecting thus a low level of diversification. On the contrary, region B presents lower phylogenetic diversity than expected, and thus it will mostly contain phylogenetically close species, e.g. resulting from events of massive diversification in the recent history.

