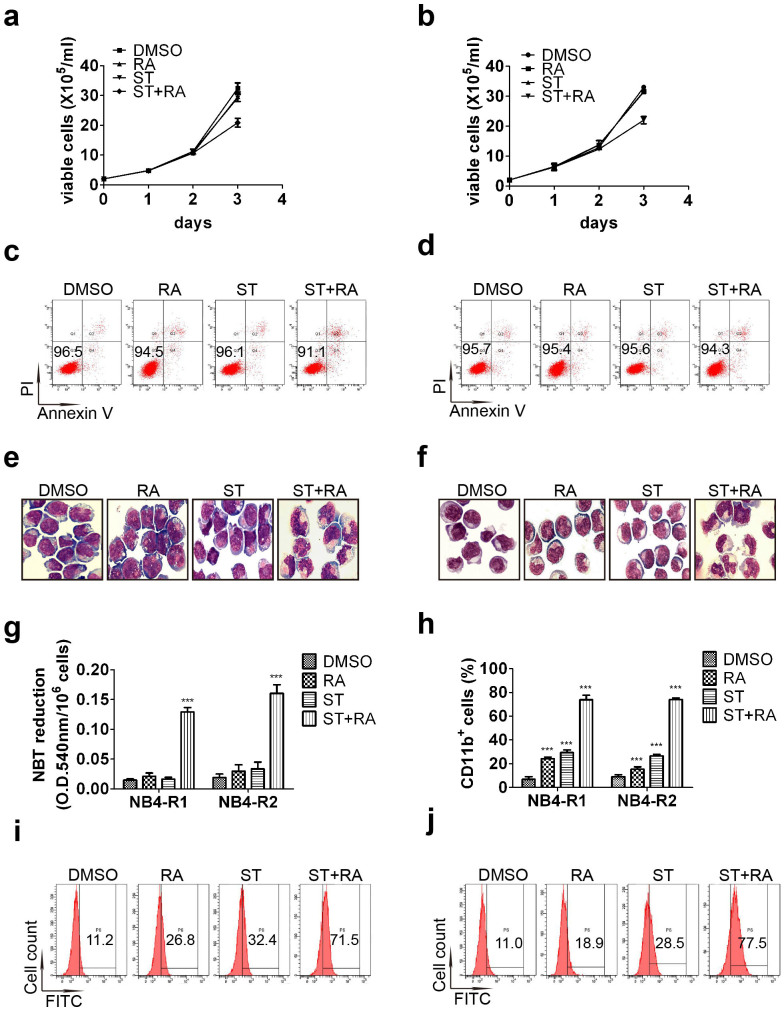
Figure 1. Effects of combined treatment on the growth, survival and differentiation in NB4-R1 and NB4-R2 cells.
Cell growth of NB4-R1 (a) and NB4-R2 (b) treated with 2 nM staurosporine(ST) or/and 1 μM ATRA(RA) was calculated as mentioned in Methods. One representative experiment was shown. Each value represented the mean ± SD of triplicate samples. Similar results were obtained in three independent experiments. Annexin-V assay of NB4-R1 (c) and NB4-R2 cells (d) treated with ST or/and RA for 72 hours. The percentages of viable (PI and Annexin V both negative) cells were shown in the corresponding panels. Results were representative among three independent experiments. Representative morphologic analysis of NB4-R1 (e) and NB4-R2 cells (f) treated with the indicated drugs for 72 hours. Similar results were obtained in three independent experiments. Differentiation was also evaluated by NBT reduction assay (g) and flow cytometric analysis of CD11b expression in NB4-R1 and NB4-R2 cells (h) with the indicated treatment for 72 hours. Each value represented the mean ± SD of three independent measurements. ***, P < 0.001 as compared with DMSO. The representative histogram of flow cytometric analysis of CD11b expression in NB4-R1 (i) and NB4-R2 cells (j) with the indicated treatment for 72 hours were also shown. The percentages of CD11b positive cells were shown in the corresponding panels.

