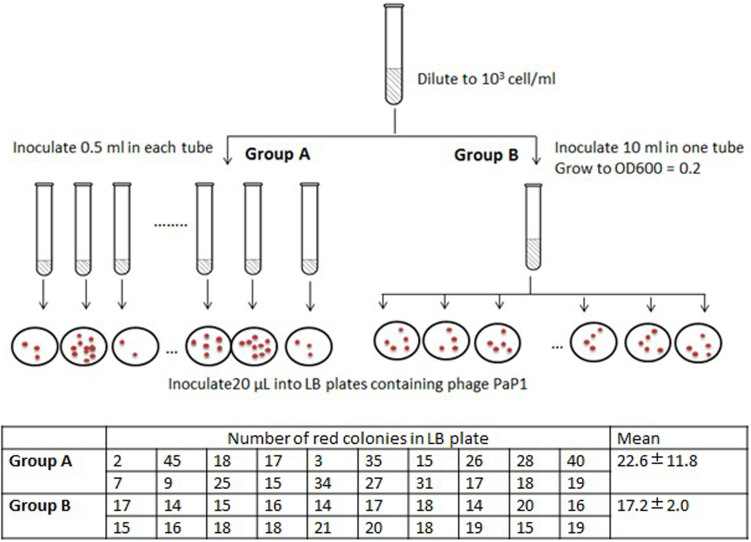
Figure 7. Red mutants arise before phage infection.
Diagram of fluctuation test is shown in the figure, and the numbers of red colonies are listed in the table. The numbers in Group A varied drastically, and the difference between group A and B is significant. (Student's t test, P < 0.05). Results from three independent replicates were similar, and this table presented the data from one replication.

