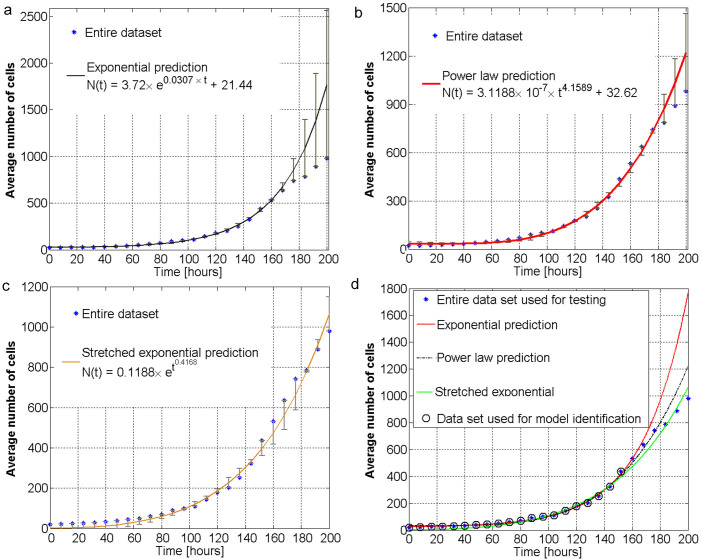
Figure 6. Implications of multi-fractal behavior on population size and their contrasting differences when considering simplified models.
(a) Comparison between the empirical average number of rat stem cells as a function of time and the exponential growth model. (b) Comparison between the empirical average number of rat stem cells as a function of time and the power-law growth model. (c) Comparison between the empirical average number of rat stem cells as a function of time and the stretched exponential growth model. (d) Empirical average number of rat stem cells as a function of time and three mathematical interpolations, i.e. exponential (red line), power law (black dotted line), and stretched exponential (green line). Their best parameters are shown in the legends in plots a–c. The first 75% of the data samples (~150 hours) also shown in black circles are used to identify the parameters of each model. The remaining 25% of the data samples (~50 hours) are used to test the prediction capabilities of each model. One can notice that the stretched exponential and power law models have better prediction capabilities than the simple exponential model. This is in agreement with our multi-fractal analysis which predicts that the intrinsic growth of stem cell population is characterized by non-exponential features.

