
Figure 3.
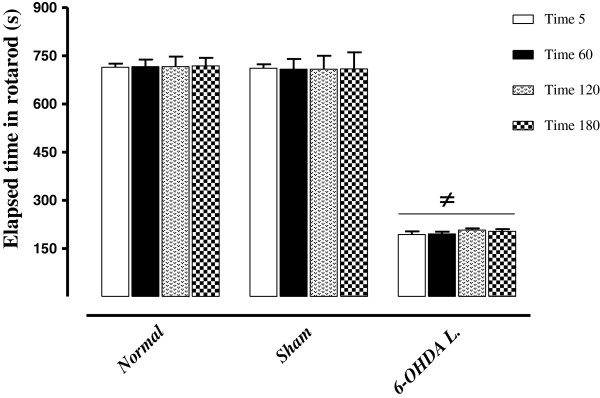
The rotarod results of normal, sham-operated and 6-OHDA-lesioned (8 μg/2 μl/rat) rats. Each bar represents the mean ± SEM of elapsed time on the rod (s); n = 8 rats for each group; ≠p < 0.001 as compared with normal and sham-operated groups. (L = .Lesioned).