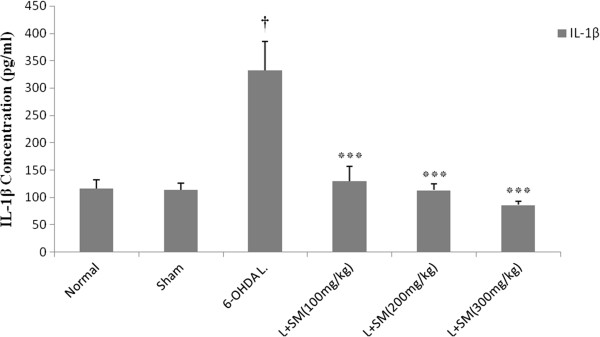
Figure 6.

The effect of i.p. administration of silymarin (SM) at the doses of 100, 200, and 300 mg/kg/day (for 5 days) on IL-1β concentration in CSF (Figure6). Values are mean ± SEM (n = 8). †P < 0.001 from respective normal value; ***P < 0.001 as compared with 6-OHDA injected group using one way ANOVA with Tukey post hoc test. (L = .Lesioned).
