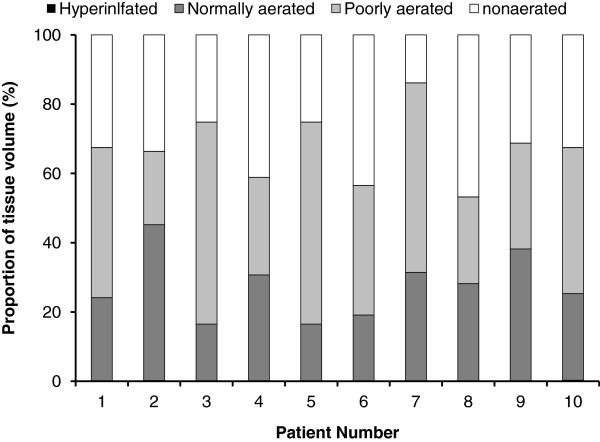
Figure 2.
Distribution of the tissue volume compartments for the whole lung in each patient. Lung compartments were classified according to CT values as hyperinflated (CT values less than -900 HU), normally aerated (between -500 and -900 HU), poorly aerated (between -100 and -500 HU), and nonaerated (between -100 and + 100 HU).

