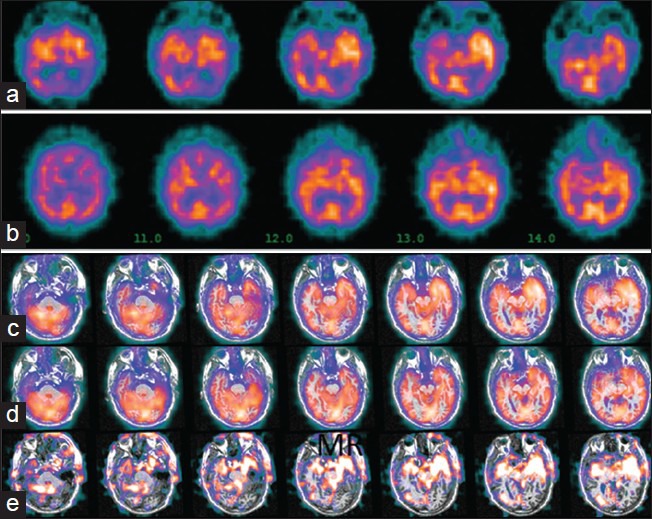
Figure 2.

Single photon emission computed tomography (SPECT) imaging and subtraction ictal SPECT co-registered to MRI (SISCOM): Patient with non-lesional left temporal lobe seizures. SPECT images show left temporal hypermetabolism in ictal images (a), compared to inter-ictal (b). Co-registration of these images to MRI makes the asymmetry more obvious in ictal (c) and inter-ictal (d) reconstructions (note that the slice angle and thickness in the reconstructions c and d are different from the raw SPECT images in a and b. Subtraction of the inter-ictal from the ictal SPECT shows the regions of maximal difference in intensity (e). Image orientation is radiological (patient left is on image right)
