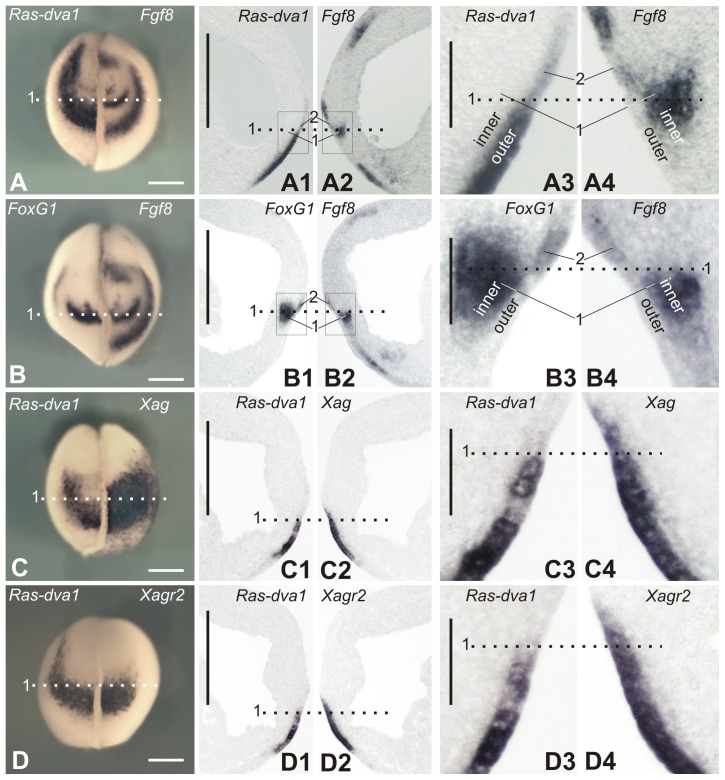
Fig. 2. Pairwise comparison of expression patterns of genes expressed in the anterior ectoderm at the midneurula stage.
(A–D) Whole-mount in situ hybridization with probes to transcripts of the indicated pairs of genes on the left and right halves of individual embryos as it is described in Fig. 1A. (A1–D1,A2–D2) In situ hybridization on adjacent vibratome sagittal sections of individual embryos with probes to indicated pairs of transcripts. Note that panels C1,D1,C2,D2 show results of hybridization made on two pairs of adjacent sections of the same embryo. (A3–D3,A4–D4) Enlarged images of fragments framed in panels A1–D1 and A2–D2. For abbreviations, see Fig. 1A–A4. Scale bars: 200 µm (A–D2), 40 µm (A3–D4).

