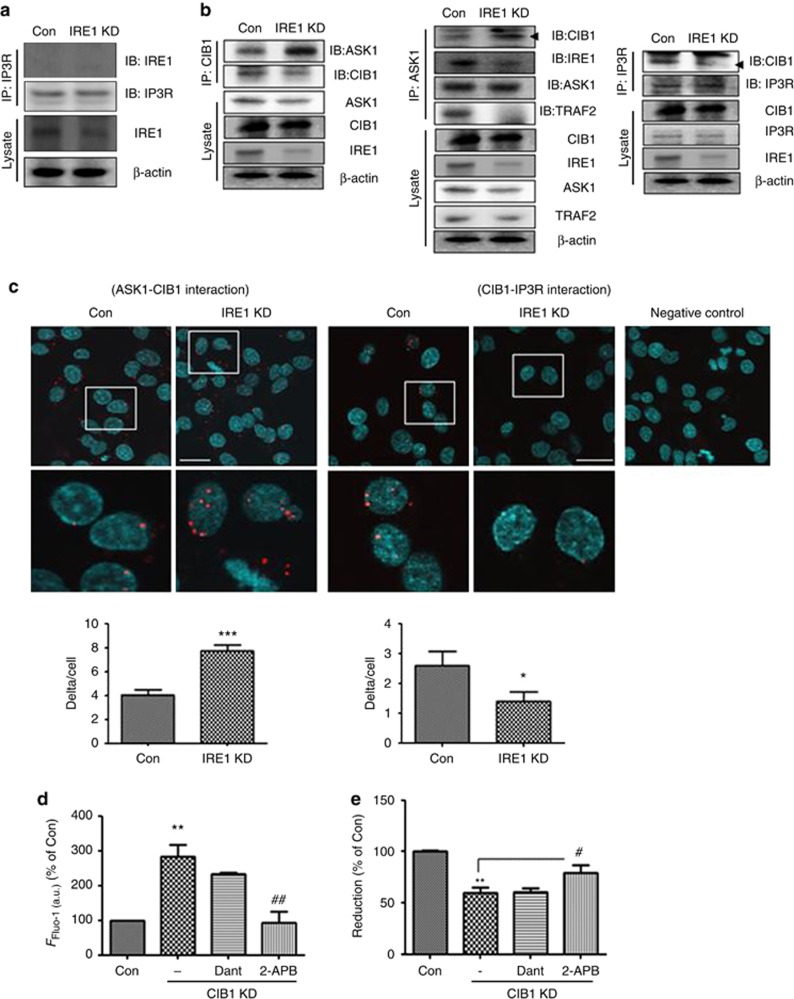
Figure 5.
IRE1α regulates InsP3R-mediated Ca2+ release through the ASK1-CIB1 interaction. (a) Co-immunoprecipitation (IP) with InsP3R- and IRE1α-specific antibodies revealed no interaction between InsP3R and IRE1α. The lower panel (‘Lysate') shows a western blot of IRE1α, using the β-actin as a loading marker. Representative images are shown; IP3R indicates InsP3R. (b) Co-IP with CIB1-, ASK1-, InsP3R-, and IRE1α-specific antibodies. The left and middle panel show increased CIB1-ASK1 interaction in IRE1α-KD cells. The right panel shows decreased CIB1-InsP3R interaction in IRE1α-KD cells. The lower panel (‘Lysate') shows a western blot of ASK1, CIB1, IRE1α, TRAF2, and InsP3R, with β-actin as a loading control. Representative images are shown. (c) Proximity ligation assay showed reduced that IRE1α levels induced ASK1-CIB1 interaction and decreased CIB1-InsP3R interaction. DAPI (blue) was used to stain nuclei. Red dot-like signals indicate close proximity of two specific proteins (anti-ASK1 (rabbit polyclonal), anti-CIB1 (mouse monoclonal), and anti-InsP3R (rabbit polyclonal) antibodies). Scale bar=25 μm. *P<0.05 and ***P<0.001 versus control siRNA-transfected cells (Con). (d) Alteration in [Ca2+]i in CIB1-KD cells was measured by Fluo-4 assay. Data were analyzed by ImageJ program. **P<0.01 versus control siRNA-transfected cells; ##P<0.01 versus CIB1 siRNA-transfected cells. (e) Cell viability was analyzed by MTT assay. 2-APB (10 μM) or dantrolene (20 μM) were added to CIB1-KD cells, and the MTT assay was performed. Data shown are the mean percentage±S.E.M. **P<0.01 versus control siRNA-transfected cells; #P<0.05 versus CIB1-KD cells. Data were obtained from at least five replicates per group (N=5 experiments)

