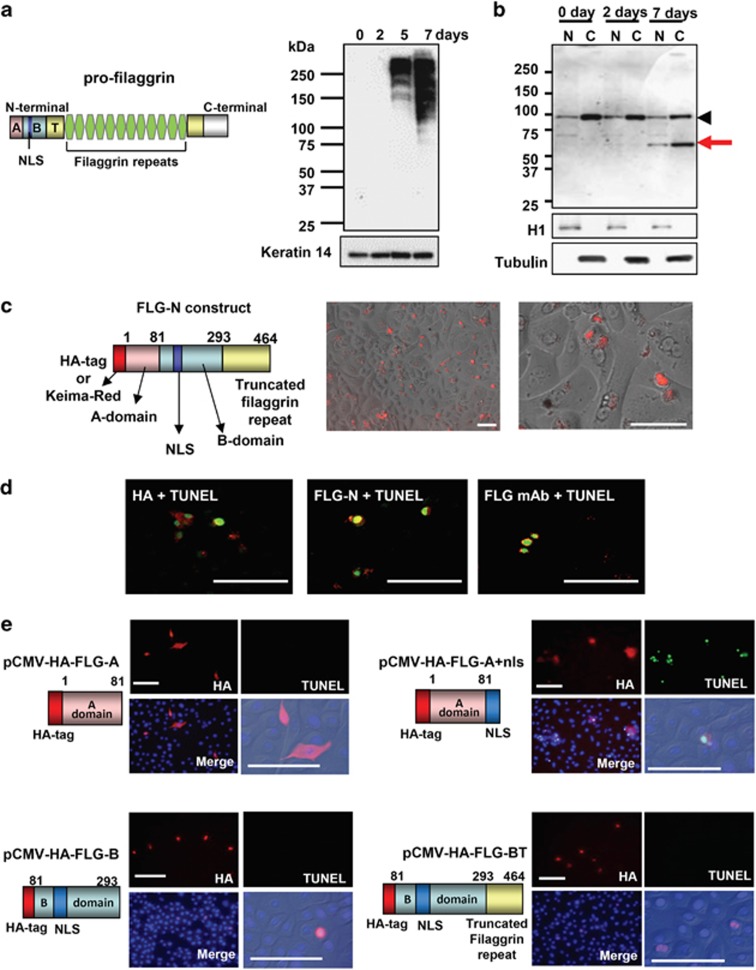
Figure 1.
Translocation of N-terminal fragment that includes truncated filaggrin repeat. (a) Profilaggrin structure and profilaggrin expression in cultured keratinocytes. Profilaggrin (∼500 kDa) consists of an N-terminal domain, 10 to 12 filaggrin repeats and a C-terminal domain. Keratinocytes were cultured until confluency (day 0). At 2, 5 and 7 days after confluency, keratinocyte extracts were examined with anti-filaggrin mAb. Keratin 14 was used as a loading control (bottom). (b) Presence of N-terminal fragment in the nuclear fraction. Cytoplasmic and nuclear extracts were obtained at confluence (day 0), and day 2 and day 7 after confluency. The presence of N-terminal fragment was detected using H-300. Note the appearance of a 55-kDa band at day 7 (red arrow). Histone H1 was used as a loading control of nuclear extracts. Tubulin was used as a loading control for cytoplasmic extracts. Arrowheads indicate nonspecific bands. (c) Schematic illustration of the profilaggrin N-terminal construct (FLG-N) and images of live FLG-N-transfected keratinocytes. Fluorescent protein, Keima-Red (KR), was fused to profilaggrin N-terminal construct of 464 amino acids, containing A domain, B domain and a truncated filaggrin repeat. After transfection into growing keratinocytes, time-lapse studies were carried out using PASCAL confocal microscopy. An image taken at 24 h after transfection is shown in the enlarged figure. Scale bars, 100 μm. (d) Presence of FLG-N in nuclei with TUNEL positivity. FLG-N was detected with anti-HA antibody (left), anti-A+B domain Ab (H300) (middle) and anti-filaggrin mAb (right). Images with TUNEL staining are shown as merged figures. FLG-N was detected with anti-filaggrin mAb (right). Scale bars, 100 μm. (e) The A domain of profilaggrin N-terminal is responsible for the induction of DNA degradation. A schematic illustration of each domain construct and results of expression studies are shown. After transfection with pCMV-HA-FLG-A, pCMV-HA-FLG-A+nls, pCMV-HA-FLG-B or pCMV-HA-FLG-BT vector, keratinocytes in the growth phase were stained for HA and TUNEL. Merged images with nuclear staining (DAPI) are shown. Enlarged images with differential interference contrast are also shown. Scale bars: 50 μm

