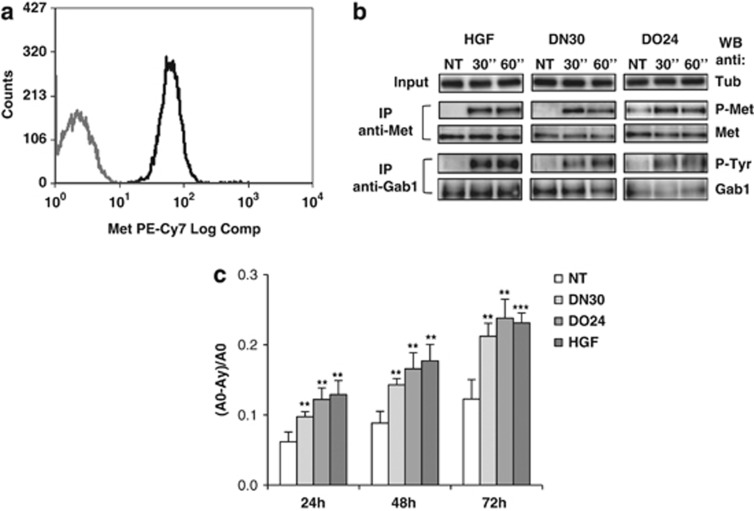
Figure 1.
H9c2 cells express the Met receptor and are responsive to the treatment with Met agonists. (a) Flow cytometry detection of Met expression on cell surface. The 99.85% of viable cells showed a high immunofluorescence signal for the anti-HGF receptor antibodies. (b) Phosphorylation of Met and Gab1 is induced by HGF, DN30 and DO24. The cells were treated briefly (30′′ and 60′′) with 0.5 nM HGF, 100 nM DN30 and DO24. Met and Gab1 IPs were analysed by WB with p-Met, Met and p-Tyr, Gab1 antibodies, respectively. Tubulin was used as loading control for the input lysates. (c) Wound-healing assay in cells treated or not (NT, white) for different lengths of time with DN30 (100 nM, light grey), DO24 (100 nM, middle grey) or HGF (0.5 nM, dark grey). Values are the mean±S.D. of three independent experiments. t-test was calculated between treated samples versus NT control at each time point. **P<0.01 and ***P<0.005

