Figure 2.
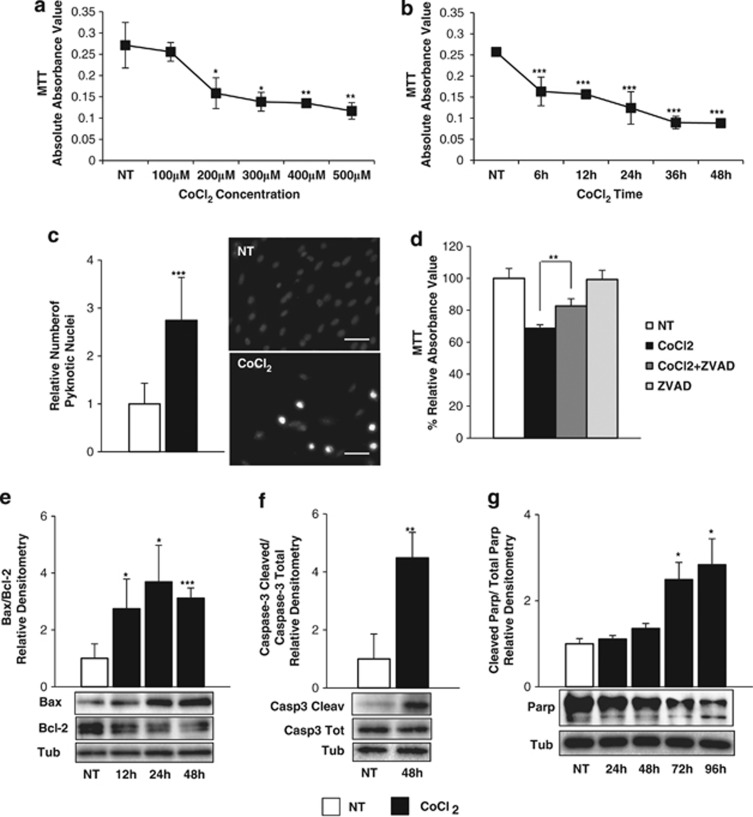
CoCl2 induces apoptosis in H9c2 cardiomyoblasts. Cell viability was evaluated through MTT analysis of (a) CoCl2 dose-dependent treatment for 24 h and (b) time-dependent treatment with 300 μM CoCl2. (c) Cells were untreated (NT, white) or treated with 300 μM CoCl2 (black) for 48 h and stained with DAPI. The percentage of pyknotic nuclei with respect to the total amount of nuclei was counted. Values are the mean±S.D. of 10 independent experiments and are expressed as fold relative to NT control. Representative images are shown on the right. Bar: 35 μm. (d) MTT was performed in NT cells (white), cells treated with 300 μM CoCl2 (black), CoCl2+50 μM zVAD caspase inhibitor (dark grey) and only zVAD (light grey) for 48 h. Results are expressed as percentage of MTT reduction, relative to NT control. (e–g) Cells were treated with 300 μM CoCl2 and analysed for apoptotic markers in WB. The values show the ratio between the densitometric quantification of (e) Bax and Bcl-2, (f) cleaved and total caspase-3, (g) cleaved and total Parp bands and are expressed as fold relative to control. Representative images are shown below each graph. Tubulin was used as loading control. Values are the mean±S.D. of three independent experiments except for (c). For t-test, CoCl2-treated samples were compared with NT cells in all the experiments except for (d) where CoCl2 versus CoCl2+zVAD samples were compared. *P<0.05, **P<0.01 and ***P<0.005

