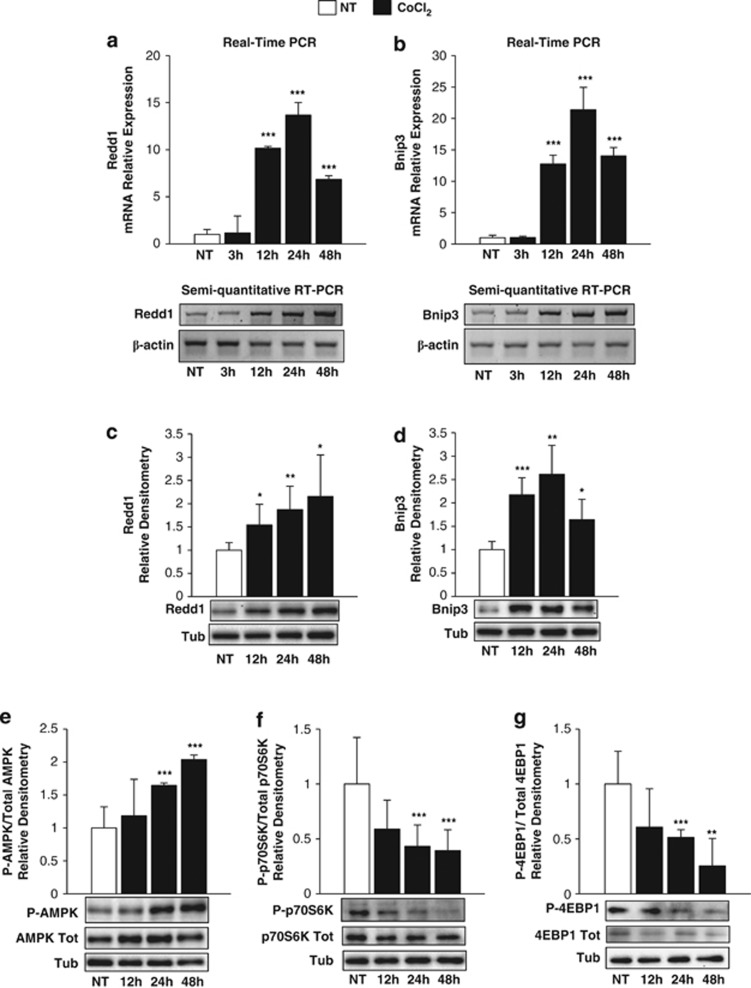
Figure 4.
CoCl2 induces negative regulation of the mTOR pathway in H9c2 cardiomyoblasts. Cells were NT (white) or treated with CoCl2 (300 μM, black) for different lengths of time. Redd1 (a) and Bnip3 (b) mRNAs were analysed by real-time PCR (upper panels) and semi-quantitative RT-PCR (lower panels). β-actin mRNA was used as loading control. Densitometric quantification of Redd1 (c), Bnip3 (d), phospho-AMPK (e), phospho-p70S6K (f) and phospho-4EBP1 (g) protein levels were determined using WB. Representative images are shown below each graph and tubulin was used as loading control. In (e–g) the values show the ratio between the densitometric quantification of phospho- and corresponding total bands. The values (mean±S.D.) were calculated in three independent experiments and are expressed as fold relative to NT. t-test was performed in treated samples versus NT. *P<0.05, **P<0.01 and ***P<0.005

