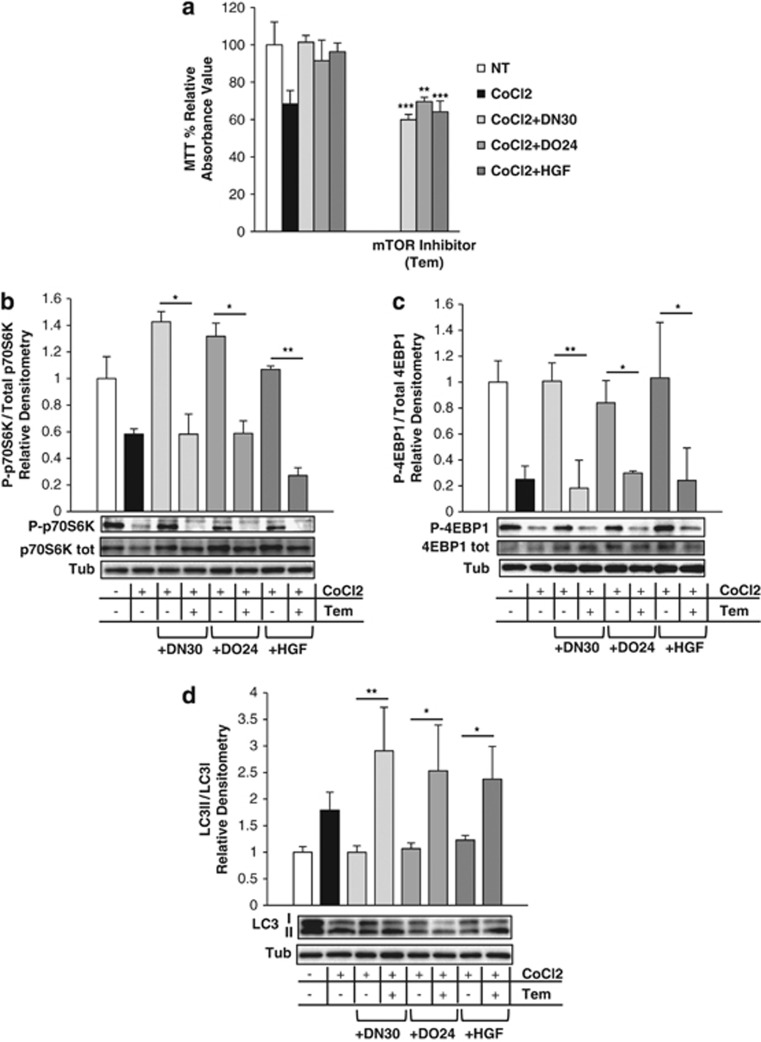
Figure 7.
The anti-autophagic effect of Met agonists is mediated by the mTOR pathway. (a) MTT analysis in cardiomyoblast NT (white) or treated with CoCl2 (300 μM, black), CoCl2+DN30 (100 nM, light grey), CoCl2+DO24 (100 nM, middle grey) and CoCl2+HGF (0.5 nM, dark grey) for 24 h with or without the presence of Tem, the mTOR inhibitor (1 μM). Results are expressed as percentage of MTT reduction, relative to NT control. The values are the mean±S.D. of three independent experiments. (b–d) Densitometric quantification of Phospho- and total p70S6K (b), phospho- and total 4EBP1 (c) and LC3II/LC3I ratio (d) by WB. Cells were NT (white) or treated with 300 μM CoCl2 (black), CoCl2+DN30 (100 nM, light grey), CoCl2+DO24 (100 nM, middle grey) and CoCl2+HGF (0.5 nM, dark grey) with or without Tem (1 μM) for 48 h. In (b and c) the values show the ratio between the densitometric quantification of phospho and corresponding total bands. The values are the mean±S.D. of three independent experiments and are expressed as fold relative to NT. Tubulin was used as loading control. Representative images are reported below each graph. For t-test each group of treated samples in the presence of Tem was compared with corresponding group without Tem. *P<0.05, **P<0.01 and ***P<0.005

