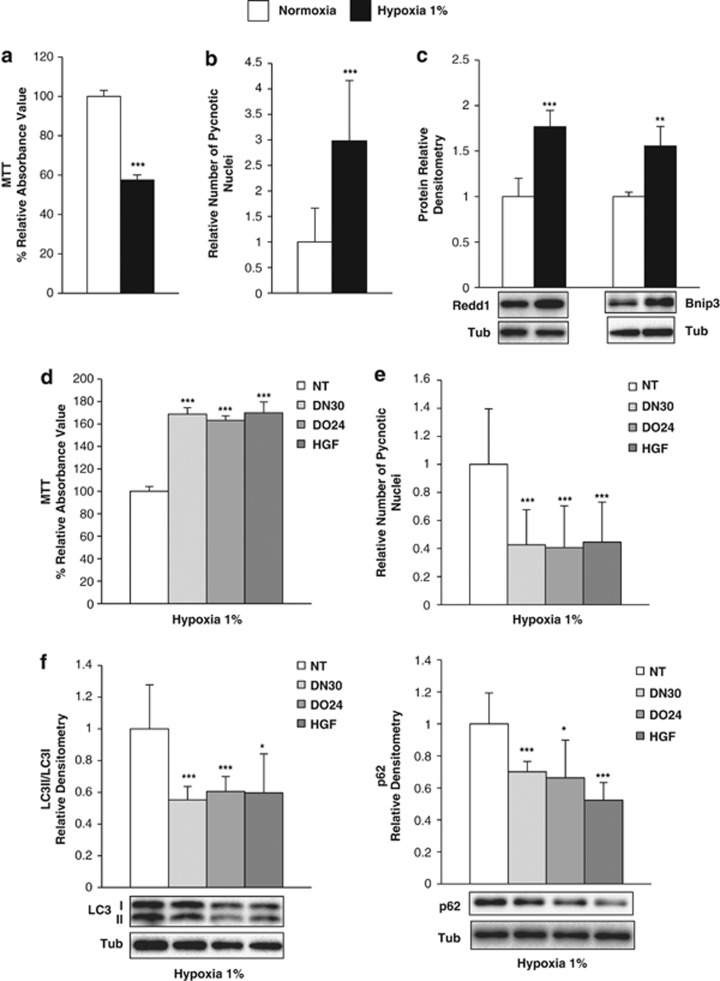
Figure 8.
Met agonists protect H9c2 cardiomyoblasts from apoptosis and autophagy in low oxygen tension. (a–c) H9c2 cells were cultured in normoxic (white) or hypoxic (black) conditions for 48 h (a and b) or 72 h (c). (a) Cell viability was measured and results are expressed as the percentage of MTT reduction. (b) The number of DAPI-stained pyknotic nuclei on the total amount of nuclei was counted. (c) The pro-autophagic Redd1 and Bnip3 proteins were analysed using WB and the densitometric quantification was performed. (d–f) Cells cultured at low oxygen tension were untreated (NT, white) or treated with DN30 (light grey), DO24 (middle grey) and HGF (dark grey) for 48 h (d and e) or 96 h (f). MAbs (100 nM) and HGF (0.5 nM) were concomitantly added with the hypoxic culture. (d) MTT analysis was performed and results are expressed as percentage of cell viability increase. (e) Cells were stained for DAPI and the number of pyknotic nuclei on the total amount of nuclei was counted. (f) Protein densitometric quantification of LC3II/LC3I ratio and p62. The mean±S.D. was calculated in three independent experiments, except for DAPI stain where 10 independent experiments were performed. The values are expressed as fold relative to control. In WB the tubulin was used as loading control and representative images are shown below each graph. t-test was calculated between treated samples versus control. *P<0.05, **P<0.01 and ***P<0.005

