. 2014 Apr 24;3:e01936. doi: 10.7554/eLife.01936

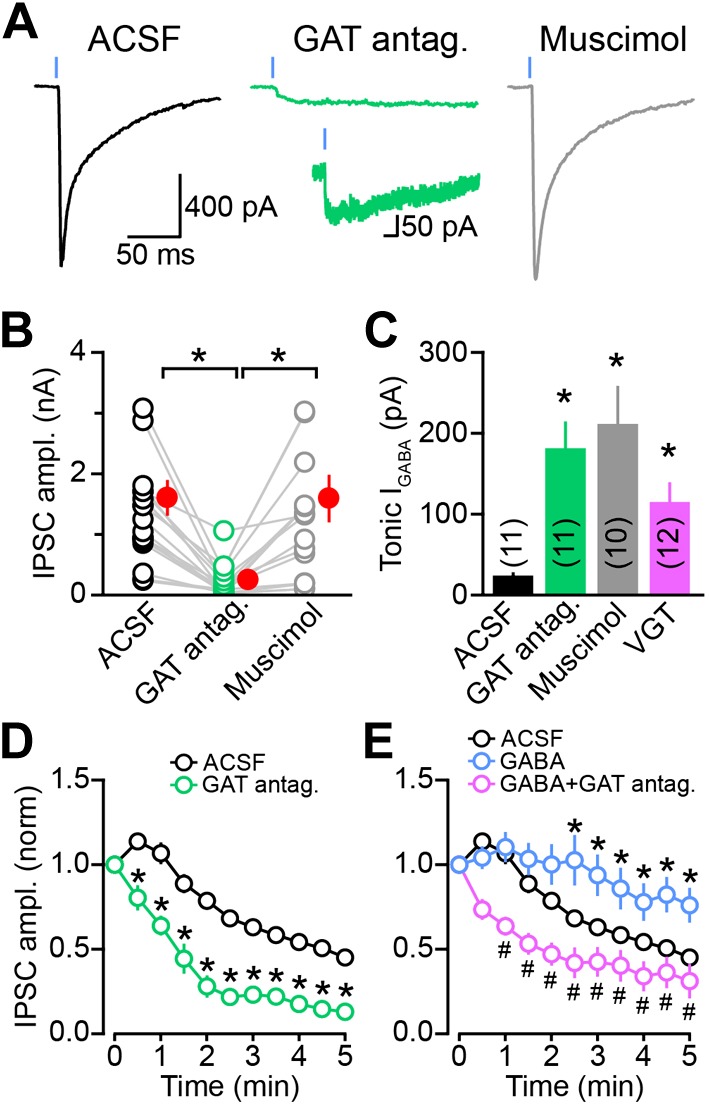
Figure 8. Sustained GABAergic signaling from DA neurons requires GAT function.

(A) Dopaminergic IPSCs evoked by strong ChR2 stimulation (1 ms, 5 mW·mm−2; blue line) in slices incubated for at least 30 min in control ACSF (left, black), muscimol (0.1 μM; right, gray) or a cocktail of mGAT1 and mGAT4 antagonists (10 μM SKF 89976A + 50 μM SNAP-5114, respectively; middle, green). Recordings were performed in the continued presence of each drug, in addition to the GABAB receptor antagonist CGP55845 (2–5 μM) and the glutamate receptor blockers NBQX (10 μM) and R-CPP (10 μM). Inset, oIPSC in GAT antagonists shown on longer time scale to illustrate slow kinetics. (B) Plot of peak oIPSC amplitudes recorded from individual SPNs in adjacent slices after prolonged incubation in ACSF (black), mGAT1 and mGAT4 inhibitors (green) and muscimol (gray). Mean (±SEM) indicated in red. *p<0.01 for indicated comparisons, Dunn's Multiple Comparison Test. (C) Histogram of tonic GABA current (IGABA) measured in SPNs as the reduction in holding current evoked by bath application of the GABAA receptor antagonist picrotoxin (100 μM) under control conditions (black), or after prolonged incubation in mGAT1 and mGAT4 blockers (10 μM SKF 89976A + 50 μM SNAP-5114; green), muscimol (0.1 μM; gray) or vigabatrin (100 μM; magenta). *p<0.01 vs ACSF, Dunn's Multiple Comparison Test. Number of recordings indicated in parentheses. (D) Plot of consecutive oIPSC amplitudes (normalized to the first light-evoked response) over time under control conditions (ACSF; black; n = 25) and after prolonged incubation in a cocktail of GAT antagonists (10 μM SKF 89976A + 50 μM SNAP-5114; green; n = 11). *p<0.001 vs ACSF, Sidak's multiple comparison test. (E) As in (D) for slices supplied with exogenous GABA (100 μM) for 5–10 min before obtaining oIPSCs from SPNs in dorsal striatum (blue; n = 10), and slices supplied with exogenous GABA after prolonged inhibition of GATs with 10 μM SKF 89976A + 50 μM SNAP-5114 (magenta; n = 12). *p<0.05 vs ACSF, #p<0.005 vs GABA, Tukey's multiple comparison test. Control traces in (D) and (E) are the same as in Figure 1—figure supplement 1D.
DOI: http://dx.doi.org/10.7554/eLife.01936.013

Figure 8.

Figure 8—figure supplement 1. Chronic GAT block does not non-specifically affect synaptic transmission at GABAergic and dopaminergic synapses.

Figure 8—figure supplement 1.

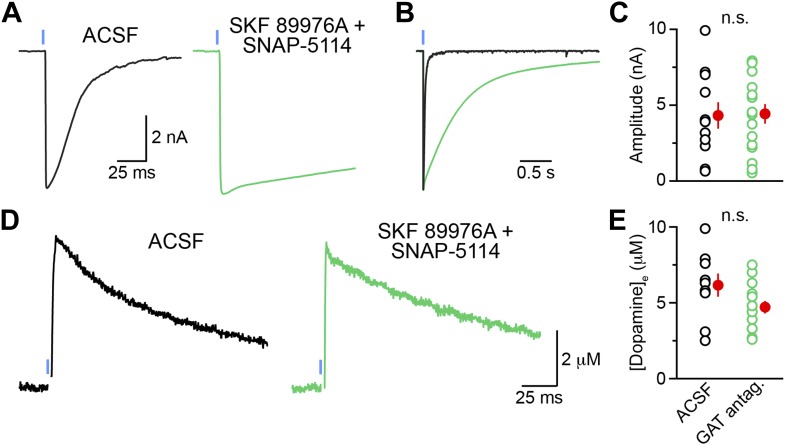
(A) Example traces of light-evoked (1 ms, 5 mW·mm−2; blue line) IPSCs recorded from neurons in the external segment of the globus pallidus (GPe; Vhold = −70 mV) in Adora2a-Cre;Ai32 mice, which express ChR2-EYFP in indirect-pathway SPNs. GPe boundaries were identified using the strong EYFP fluorescence of iSPN axonal terminals. Slices were incubated for at least 30 min in ACSF (left, black) or in a cocktail of 10 μM SKF 89976A and 50 μM SNAP-5114 (right, green). Pre-incubations and recordings were performed in the continued presence of each drug, in addition to CGP55845 (5 μM), NBQX (10 μM) and R-CPP (10 μM). (B) Amplitude normalized traces from (A) shown on an expanded time scale to reveal the slow decay kinetics of IPSCs in the presence of GAT antagonists. (C) The peak amplitude of striatopallidal oIPSCs did not significantly differ (p=0.7; Mann–Whitney test) between slices bathed in ACSF (black; n = 11 GPe neurons) and slices chronically incubated in GAT blockers (green; n = 16 GPe neurons), indicating that this pharmacological manipulation does not inhibit synaptic transmission at ‘classical’ GABAergic synapses. Mean (±SEM) shown in red. (D) Representative traces of light-evoked (1 ms, 5 mW·mm−2; blue lines) DA release in the dorsal striatum of Slc6a3-ires-Cre;Ai32 measured by carbon-fiber amperometry. Pharmacological conditions are identical to those in (AC). Stimulation artifacts are blanked for clarity. (E) Peak extracellular DA concentration measured in dorsal striatum slices incubated in ACSF (black; n = 9 slices) or in GAT antagonists (green; n = 14 slices). Population means (±SEM in red) did not differ significantly (p=0.09; Mann–Whitney test).
Figure 8—figure supplement 2. oIPSC rundown is activity dependent.

Figure 8—figure supplement 2.

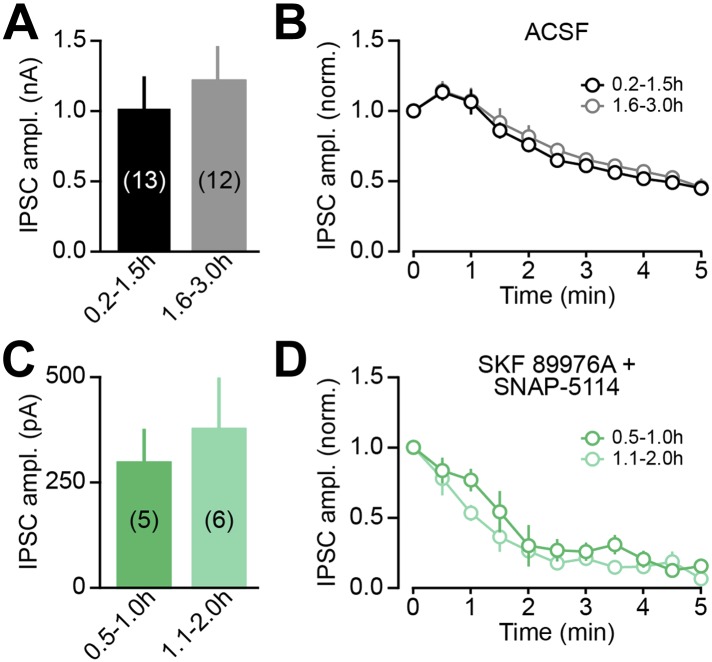
(A) The peak amplitude of the first oIPSC recorded in dorsal striatum SPNs within the first 1.5 hr after slicing (black) was comparable to that recorded during the next 1.5 hr (gray), indicating that oIPSCs do not rundown with time in the absence of stimulation. Data in this and subsequent panels represent mean ± SEM. The number of SPNs recorded is indicated in parentheses. (B) The time course of synaptic transmission rundown by consecutive light stimuli was similar in the two groups of slices, confirming that recording conditions in the first and second halves of recording sessions are comparable, and that synaptic rundown of DA neuron oIPSCs is dependent on activity. (CD) As in (AB) for slices chronically incubated for 0.5–1.0 hr (dark green) or 1.1–2.0 hr (light green) in SKF 89976A (10 μM) + SNAP-5114 (50 μM). The effect of GAT inhibition on oIPSC amplitude does not vary with pre-incubation duration (C), indicating that our pharmacological manipulation depletes synaptic GABA levels within 30 min. Importantly, stimulation-evoked rundown in GAT blockers is accelerated (contrast panels B and D), consistent with activity dependent depletion of vesicular GABA when cytoplasmic GABA levels are not replenished by GATs.