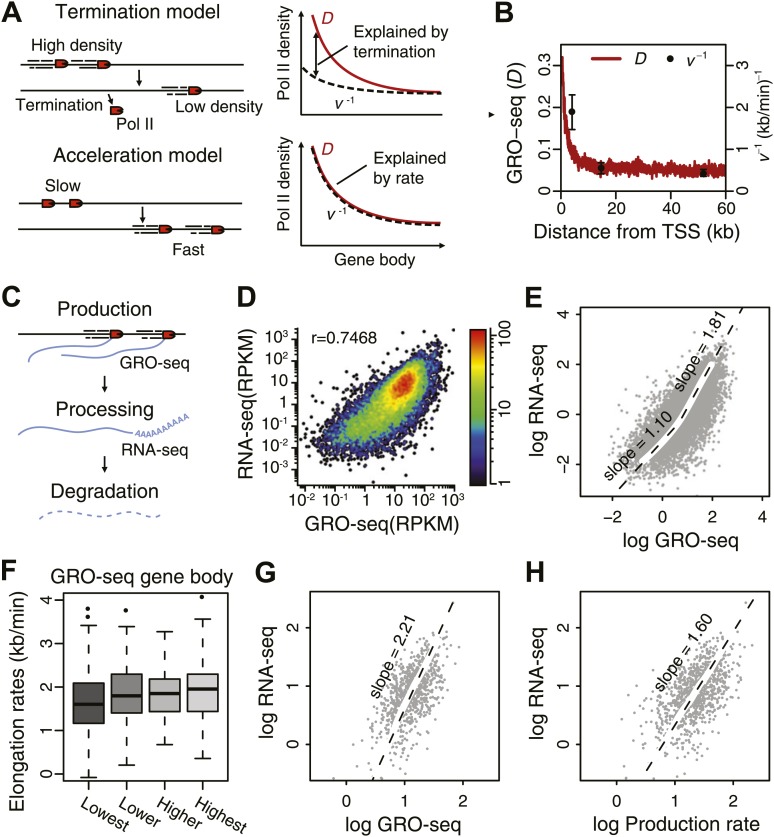
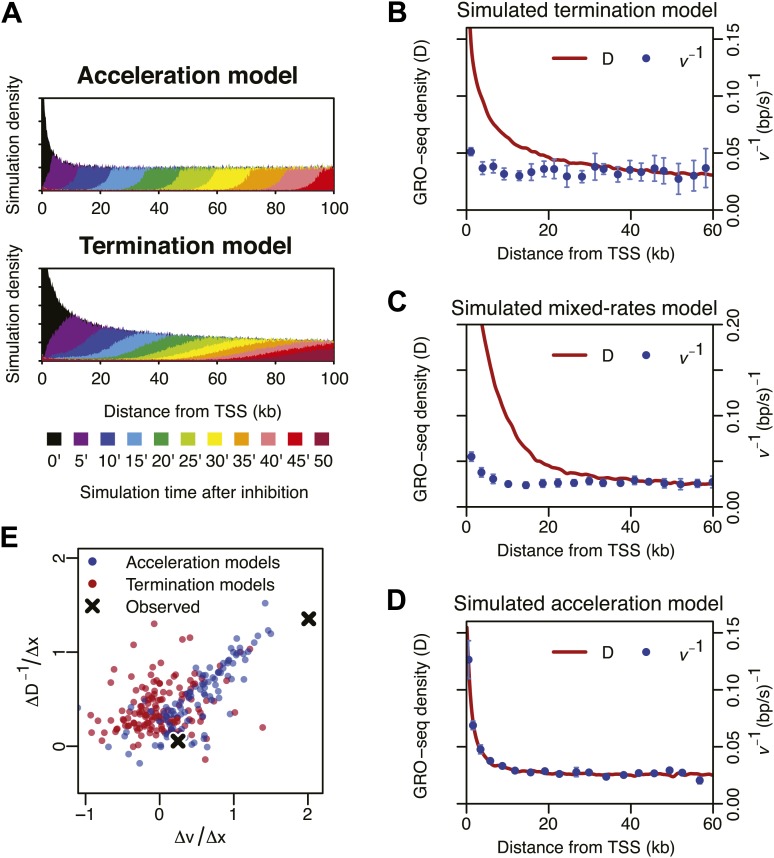
Figure 4. Elongation rate explains transcriptional stability and the steady-state output.
(A) Models of Pol II elongation (left), and the expected steady-state GRO-seq density (D) and the inverse elongation rates (v−1) for each model (right). The termination model proposes that the decrease in D is a combination of Pol II termination and increasing elongation rate, while the acceleration proposes that the decrease in D is primarily a consequence of increasing elongation rate. (B) The steady-state GRO-seq density (D) and inverse elongation rates (v−1) from average transition points of the FP measurements. (C) Stages of transcription determining the mRNA level following the productive elongation stage. (D) Correlation plot between GRO-seq gene body density as a measure of nascent transcription and RNA-seq as a measure of mRNA steady state level. (E) Non-linear correlation between nascent transcription level and mRNA level in highly transcribed genes. To determined the monomial degree of the correlation, a LOESS fit was used for the scatterplot in D, and the slopes of the LOESS fit in the higher 50 percentile and the lower 50 percentile were derived. (F) Elongation rate correlates with GRO-seq density. Correlation plot was determined from the z-scores of the elongation rates and the gene body GRO-seq densities. (G) Correlation of mRNA steady state level and GRO-seq of the 938 mid elongation rate genes (12.5–25 min), and the monomial degree of the correlation derived from the slope. (H) Correlation plot of the mRNA production rate (GRO-seq density multiplied by the elongation rate) and mRNA steady state level of the same genes, and the monomial degree of the correlation.


