Figure 5.
PGX1 Expression in Different Tissues.
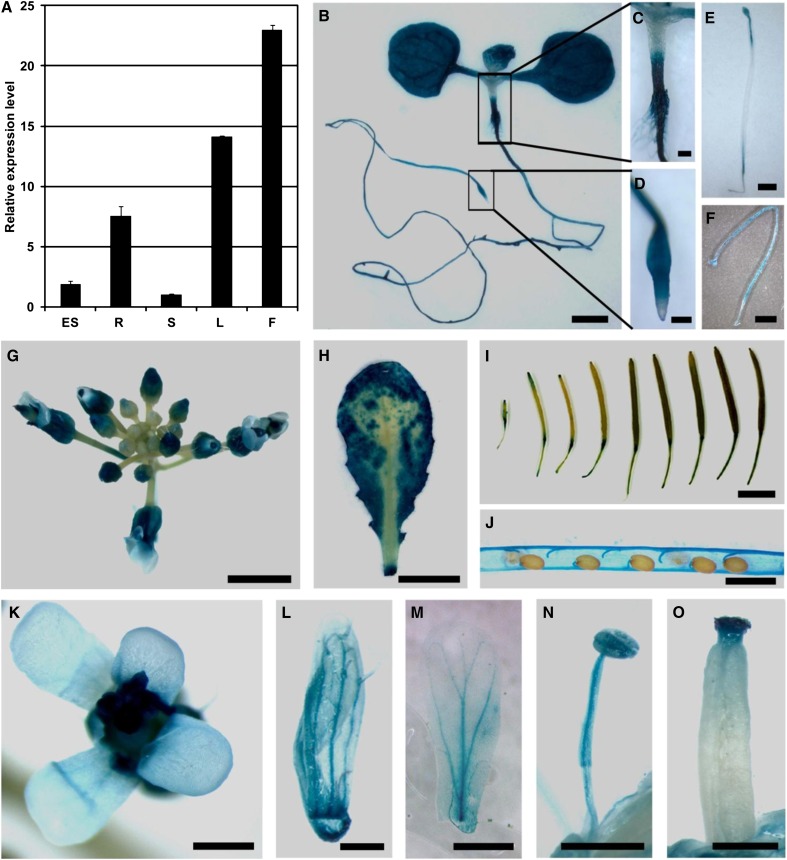
(A) Relative expression levels of PGX1 in different tissues including 6-d-old etiolated seedlings (ES) and 6-week-old Col roots (R), stems (S), leaves (L), and flowers (F) as measured by qPCR. ACT2 was used as an internal control, and stem PGX1 expression was normalized to 1. Bars show averages ± sd (n = 3 replicates).
(B) to (O) GUS staining of PGX1pro:GUS transgenic plants.
(B) Five-day-old light-grown PGX1pro:GUS seedling.
(C) and (D) Close-up images of hypocotyl and root tip of PGX1pro:GUS seedling in B.
(E) and (F) Two-hour and 12-h staining images of 6-d-old etiolated PGX1pro:GUS seedlings.
(G) to (J) Inflorescence, leaf, and silique of 6-week-old PGX1pro:GUS plants.
(K) to (O) Flower, sepal, petal, pistil, and stamen of PGX1pro:GUS plants.
Bars = 500 μm in (B), (E), and (J) to (O), 100 μm in (C) and (D), 2 mm in (F) and (G), and 5 mm in (H) and (I).

