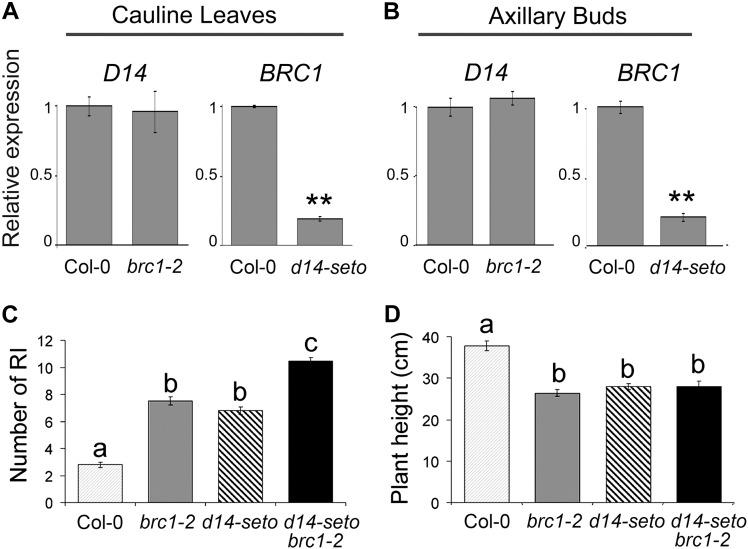
Figure 2.
Genetic Relationship between BRC1 and D14.
(A) and (B) Transcript abundance of D14 and BRC1 in cauline leaves (A) and axillary buds (B) of wild-type, d14-seto, and brc1-2 quantified by qPCR. Data shown as mean ±se (n = 3 to 5 biological replicates). Asterisks denote significant differences in Student’s t test (**P < 0.01).
(C) Number of RI (primary rosette branches) of wild-type, brc1-2, d14-seto, and d14-seto brc1-2 F3 plant siblings.
(D) Height of the main inflorescence of the same plants. Letters denote significant differences in one-way ANOVA test (Tukey test P < 0.05). Data shown as mean ±se (n = 20).

