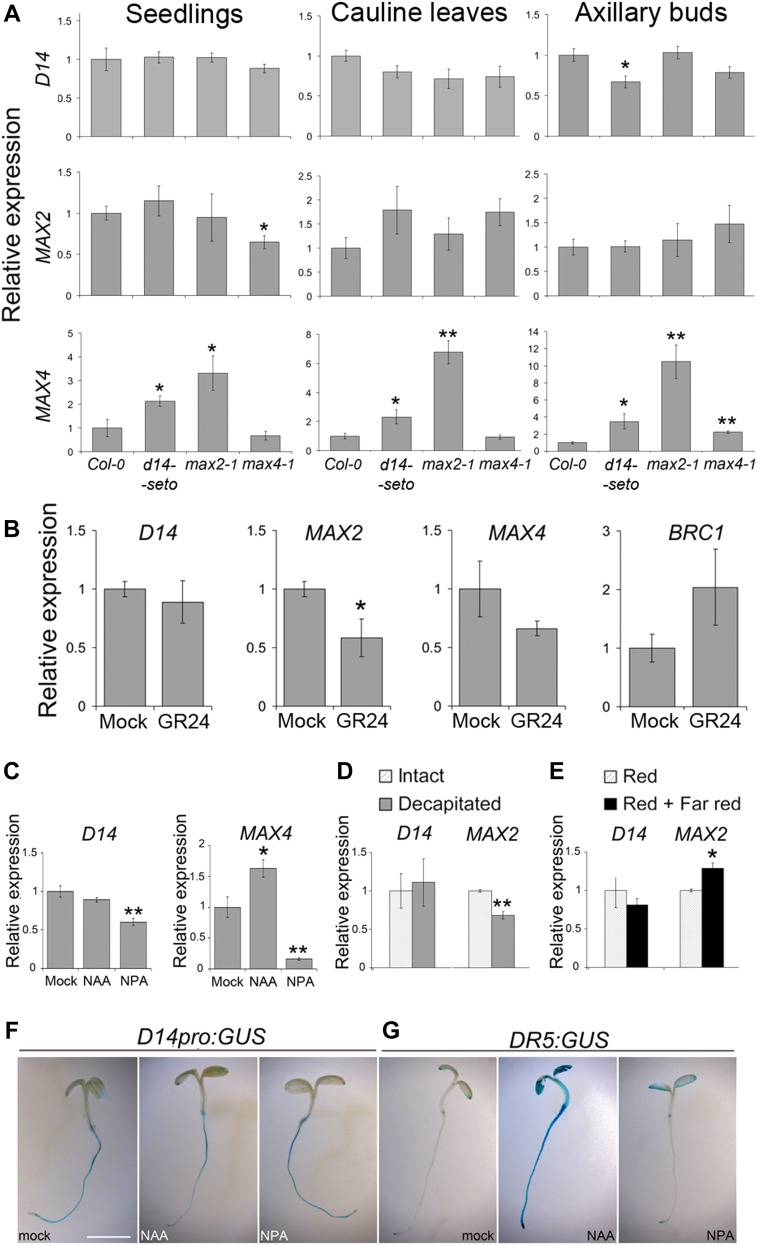
Figure 6.
Transcriptional Regulation of D14.
(A) qPCR quantification of D14, MAX2, and MAX4 transcript abundance in seedlings, cauline leaves, and axillary buds of d14-seto, max2-1, or max4-1 plants relative to levels in wild-type Col-0 plants.
(B) Transcript abundance of D14, MAX2, and MAX4 and BRC1 in seedlings treated for 24 h with 5 μM GR24 (synthetic SL analog) compared with mock-treated plants.
(C) D14 and MAX4 transcript levels in 10-d-old seedlings treated with 10 μM NAA or 10 μM NPA (auxin transport inhibitor) relative to levels in mock-treated plants.
(D) and (E) D14 and MAX2 mRNA levels measured in axillary buds of decapitated plants 8 h after treatment relative to levels in intact plants grown in parallel (D) and of plants treated with red + far-red light for 8 h relative to levels in red light–treated plants grown in parallel (E).
(F) and (G) Histochemical assays of D14pro:GUS (F) and DR5:GUS (G) in 4-d-old seedlings treated for 24 h with 10 μM NAA, 10 μM NPA, or mock. Bar = 1 mm for (F) and (G). Data shown as mean ± se (n = 3 to 4 biological replicates). Asterisks denote significant differences in Student’s t test (*P < 0.05; **P < 0.01).

