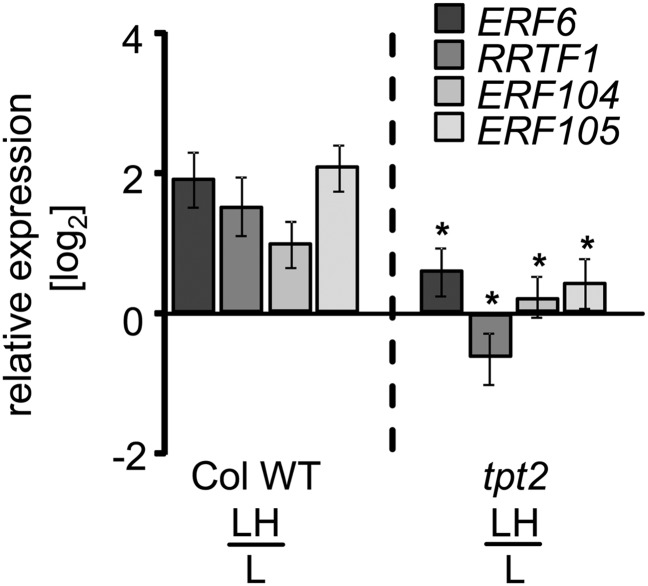
Figure 4.
Comparison of AP2/ERF-TF Transcript Levels in Wild-Type Plants and tpt2 Mutant (Col-0).
ERF6, RRTF1, ERF104, and ERF105 transcript levels were quantified in wild-type plants and tpt2 mutant defective in TPT 10 min following the L→H transfer (quantitative PCR, n = 3 independent experiments with duplicate determinations, mean ± se, asterisks indicate significant difference from the wild-type transcript level, Student’s t test P < 0.05).

