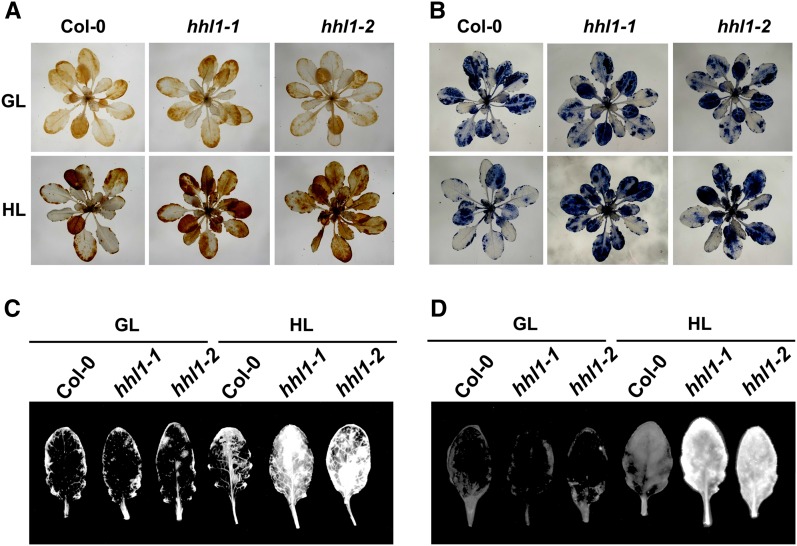
Figure 3.
Analysis of ROS in the Wild Type and hhl1 Mutants.
(A) DAB staining of H2O2 in 3-week-old wild-type (Col-0), hhl1-1, and hhl1-2 plants under growth light (top panel) and after growing under high light for 2 d (bottom panel). GL, growth light; HL, 2-d high-light treatment.
(B) NBT staining of O2− in 3-week-old wild-type (Col-0), hhl1-1, and hhl1-2 plants under growth light (top panel) and after growing under high light for 2 d (bottom panel).
(C) Detection of 1O2 with SOSG in wild-type (Col-0), hhl1-1, and hhl1-2 plants under growth light and after growing under high light for 2 d.
(D) Detection of total ROS with DCF in wild-type (Col-0), hhl1-1, and hhl1-2 plants under growth light and after growing under high light for 2 d. Five additional independent biological replicates were performed, and similar results were obtained.
[See online article for color version of this figure.]

